
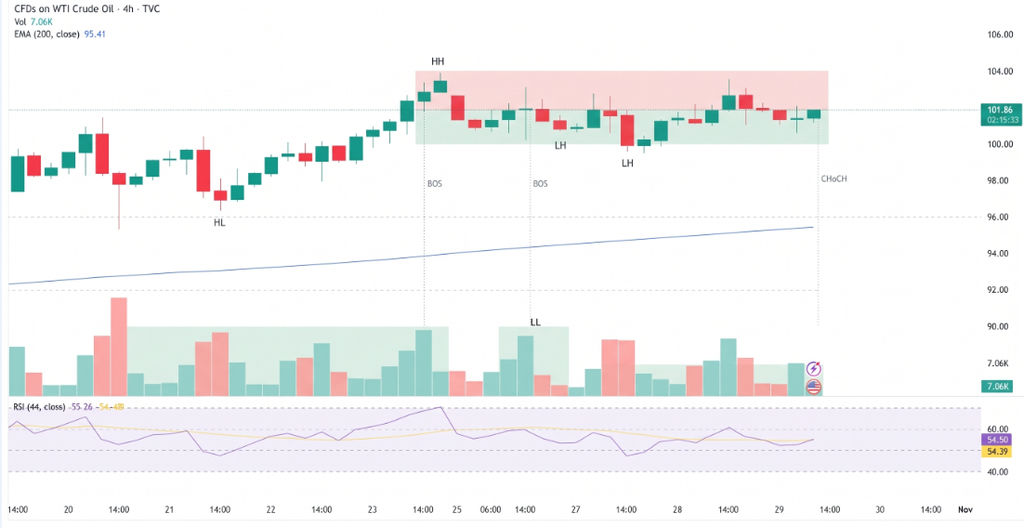
WTI crude oil is consolidating near $101.50, with technical analysis pointing to a potential bull flag after a strong advance. The pattern could support another move higher, but weakening momentum, declining trading volume and repeated hesitation near resistance suggest that a breakout is not yet confirmed. Traders are watching support between $98.50 and $99.80 and resistance around $103.00–$103.55. A sustained move beyond either boundary could determine the next directional move, while a break below support would weaken the bullish outlook.
WTI Price Holds Near Key Resistance
The supplied chart readings place WTI above its 200-day simple moving average (SMA) at $95.64, indicating that the broader trend remains positive. The SuperTrend indicator sits near $98.48, while the Ichimoku Cloud spans approximately $98.75–$101.20. These indicators identify areas where buyers may attempt to defend the current structure.
However, the short-term picture is less decisive. The Moving Average Convergence Divergence (MACD) line is reported at 0.60, below its 0.72 signal line, while the Relative Strength Index (RSI) stands near 53. That combination suggests momentum has cooled, although it does not independently confirm a reversal.
The reported bull flag is around 80% complete, with declining volume during consolidation. Traders generally look for a decisive breakout accompanied by stronger volume before treating this pattern as confirmed.
Bullish and Bearish Scenarios
A move above the recent swing high at $103.55 would strengthen the bullish case. Conversely, a decline below the $98.48 SuperTrend level could signal that the consolidation is developing into a deeper correction.
Key levels from the supplied technical setup include:
- Resistance: $103.00–$103.55; a confirmed break could open a path toward $106.75 and $108.00.
- Initial support: $99.80, followed by $98.50.
- Lower support: $97.30, the reported 38.2% Fibonacci retracement, and $95.37 near the 50% retracement.
- Bullish invalidation: A sustained move below $98.48 would weaken the near-term positive setup.
The bullish scenario would gain credibility if WTI closes above nearby resistance with expanding volume. A pullback toward $99.80 followed by a clear reversal could also support a continuation attempt. On the bearish side, rejection near $103.00–$103.55, combined with accelerating downside momentum, could bring the $100.00 and $98.50 areas back into focus.
What Traders Should Watch Next
WTI remains vulnerable to sharp moves because oil prices respond to changes in supply expectations, geopolitical developments, inventory reports and the outlook for global demand. Recent market coverage has highlighted the influence of US-Iran diplomatic developments and concerns about Middle East oil supply on crude prices
The reported average true range (ATR) of $1.55 also signals the potential for meaningful daily price swings. Traders should account for this volatility when evaluating stop-loss placement and position size rather than relying on a pattern alone.
Conclusion
WTI’s structure near $101.50 leaves room for further gains, but the bull flag remains a potential setup rather than a confirmed breakout. A sustained move above $103.55 would strengthen the bullish case, while a break below $98.48 would increase the risk of a deeper pullback. Confirmation from price action and volume remains essential.
Sources & Methodology
Primary-source standard: Market-moving facts should link to original data releases, regulator notices, company filings or official project announcements whenever available. Secondary reporting is used for additional context, not as a substitute for original evidence.
Page last reviewed: