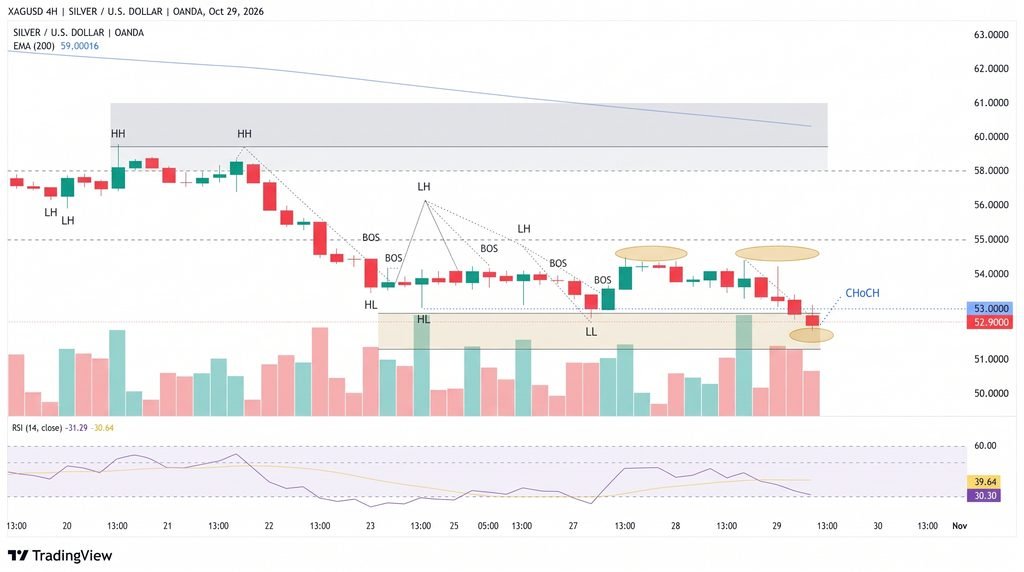
Silver remains under pressure near $52.91, with a descending price channel and bearish technical signals putting the critical $52.66 support level at risk. The supplied chart analysis points to a strong downtrend, although momentum indicators suggest selling pressure could ease temporarily. A sustained break below support may expose lower targets at $50.68 and $49.40, while a recovery above $54.75 would challenge the bearish outlook. Market data from October 29 also confirms that silver has been trading lower, with prices varying by provider and quote time.
Silver Downtrend Tests $52.66 Support
The supplied technical snapshot shows silver trading below its Ichimoku Cloud, which spans $54.21 to $55.71. The SuperTrend indicator is also bearish at $55.74, leaving a substantial resistance zone above the current price.
The Average Directional Index (ADX) stands at 41.46. Readings above 25 commonly indicate a strong trend, while the negative directional indicator, or -DI, at 27.53 supports the bearish interpretation. The Relative Strength Index (RSI) is near 33.66, approaching the widely used oversold threshold of 30. However, oversold conditions can persist during strong declines and do not guarantee an immediate rebound.
The MACD indicator histogram is slightly positive at 0.0526 in the supplied snapshot, suggesting bearish momentum may be fading. That signal remains tentative while silver trades below major resistance.
Key Silver Price Levels to Watch
The descending channel places $52.66 at the center of the near-term outlook. A decisive close below this level, supported by stronger trading volume, would offer clearer evidence of a breakdown than a brief intraday move.
Key levels from the supplied analysis include:
- Immediate support: $52.66, with further downside references at $50.68, $49.40 and $48.00.
- Resistance zone: $53.85–$54.75, where technical indicators may limit rebounds.
- Major trend resistance: $55.60–$55.74; a sustained recovery above this area would weaken the bearish structure.
- Fibonacci reference: $57.02, identified as a 23.6% retracement level.
These figures are chart-based scenarios, not guaranteed price targets. The reported average true range of $0.854 also highlights the potential for meaningful short-term fluctuations.
Could Silver Rebound From Oversold Levels?
A recovery remains possible if buyers defend the $52.00–$52.66 area and establish a clear reversal pattern. A move above $54.75 would provide stronger evidence that selling pressure is easing. Until then, rallies toward resistance could attract additional selling.
Macroeconomic conditions may also influence silver. The metal is sensitive to movements in the US dollar, interest-rate expectations and industrial demand. On October 29, Reuters reported that precious metals were pressured as investors assessed Federal Reserve signals and awaited US inflation data.
Conclusion
Silver’s near-term bias remains bearish near $52.91, but $52.66 is the decisive level. A confirmed breakdown could expose $50.68, while a sustained move above $54.75 would challenge the downside case. Traders should wait for confirmation from price action and volume rather than rely on indicators in isolation.
Sources & Methodology
Primary-source standard: Market-moving facts should link to original data releases, regulator notices, company filings or official project announcements whenever available. Secondary reporting is used for additional context, not as a substitute for original evidence.
Page last reviewed: