
Gold’s technical outlook remains vulnerable to further losses as prices consolidate near $4,041.75 on the supplied chart, with a potential bear flag signaling continued downside risk. Momentum indicators show some short-term stabilization, but the broader trend remains bearish, with gold trading below its 50-period and 200-period moving averages. The immediate focus is the $3,989 support level. A decisive break below that floor could expose gold to $3,950 and $3,900, while resistance between $4,080 and $4,111 may limit any recovery.
Gold Bear Flag Signals Downside Risk
The chart identifies a bear flag pattern near $4,040 and estimates that the formation is approximately 80% complete. A bear flag typically develops when prices consolidate or recover modestly after a sharp decline. A confirmed break below the pattern’s lower boundary can signal that the previous downtrend may resume, although the pattern alone does not guarantee further losses.
The broader technical structure favors sellers. The SuperTrend indicator points downward at $4,097.20, while the 50-period simple moving average stands at $4,111.65, below the 200-period average at $4,260.39. Gold also remains beneath the Ichimoku cloud, which spans $4,059.78–$4,104.75, adding another layer of overhead resistance.
Some indicators suggest selling pressure has eased. The MACD indicator shows a bullish momentum crossover, while the Relative Strength Index (RSI) has recovered to 43.45. Gold is also slightly above its 20-period moving average at $4,038.32. However, these signals do not yet confirm a trend reversal, particularly as trading volume is declining.
Key Gold Levels to Watch
The immediate battle is between support near $3,989 and resistance around $4,080–$4,111. The 38.2% Fibonacci retracement sits at $4,092.20, close to the SuperTrend level at $4,097.20. This technical overlap strengthens the importance of the resistance zone.
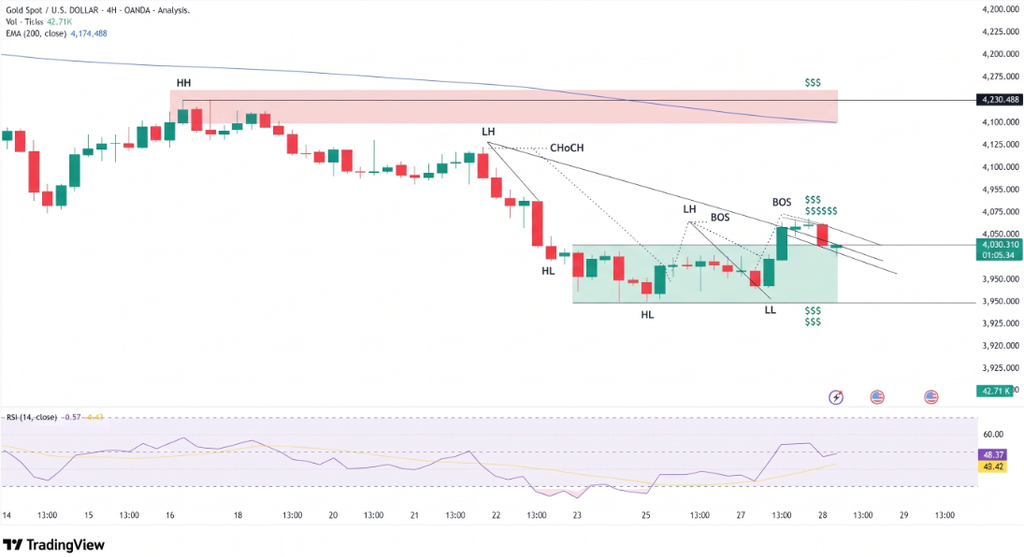
The main levels from the supplied chart are:
- Support: $3,989, followed by $3,950 and $3,900.
- Resistance: $4,080–$4,111, followed by $4,124 and $4,155.
- Bearish invalidation: A sustained move above $4,111.65 would weaken the immediate bearish setup.
- Volatility: The Average True Range (ATR) is 28.62, indicating meaningful price fluctuations.
A five-hour close below $4,020 would strengthen the bearish scenario outlined in the supplied analysis. Conversely, a sustained recovery above $4,111.65 would challenge the bear-flag thesis and bring $4,155 and potentially $4,200 into focus. These are conditional technical scenarios, not guaranteed price targets.
Conclusion
Gold’s near-term bias remains bearish while prices stay below the $4,080–$4,111 resistance cluster. A confirmed break below $3,989 could open the way toward $3,950 and $3,900, while a sustained recovery above $4,111.65 would weaken the bear-flag outlook.
Fundamental risks reinforce the cautious picture. On October 28, Reuters reported that spot gold was trading at $4,030.20 an ounce as rising oil prices heightened inflation concerns ahead of the Federal Reserve’s policy decision. Higher energy costs can keep interest rates elevated, increasing the opportunity cost of holding gold, which pays no interest. Traders were also watching the Fed’s guidance and upcoming U.S. inflation data for clues about the rate outlook.
The key signal is whether gold can defend $3,989 or breaks below it with sustained selling. Until prices reclaim the resistance cluster, rallies may face renewed selling pressure. Traders should combine confirmation from price action with the broader interest-rate outlook rather than relying on the bear-flag pattern alone.
Sources & Methodology
Primary-source standard: Market-moving facts should link to original data releases, regulator notices, company filings or official project announcements whenever available. Secondary reporting is used for additional context, not as a substitute for original evidence.
Page last reviewed: