Silver extended its decline to $52.82 in the supplied October 27 technical snapshot, with a sharply oversold Relative Strength Index (RSI) highlighting the possibility of a temporary rebound. However, the broader trend remains bearish: the metal is trading below its Ichimoku Cloud, while the Average Directional Index (ADX) signals a strong trend. Traders face a difficult balance between continued selling pressure and the risk of a short-covering rally. The $52.00 support area and $55.00 resistance zone are the immediate levels to watch.
Silver Downtrend Strengthens Below $55
The descending channel remains active, with silver approaching projected support near $52.00 after falling from $58.76 to $52.73. The latest bearish Marubozu candlestick—a candle with little or no wick—indicates that sellers controlled most of the measured five-hour session.
Broader market conditions have also pressured precious metals. On October 27, Reuters reported that a stronger US dollar weighed on gold ahead of the Federal Reserve’s policy decision, while silver fell 2.1%. Rising energy prices have increased inflation concerns and reinforced expectations that interest rates could remain elevated for longer. Higher rates and a stronger dollar can reduce the appeal of metals that do not pay interest.
Silver also faces an additional challenge because industrial consumption links its price to manufacturing activity as well as investment demand. Recent market analysis has highlighted pressure from higher yields, dollar strength and concerns about industrial demand.
RSI at 23 Raises Rebound Risk
The supplied RSI reading of 23.05 is below the widely watched 30 threshold, a level commonly associated with oversold conditions. The Money Flow Index (MFI) at 13.28 also points to intense selling pressure. Neither indicator guarantees a recovery, particularly when a strong trend remains in place.
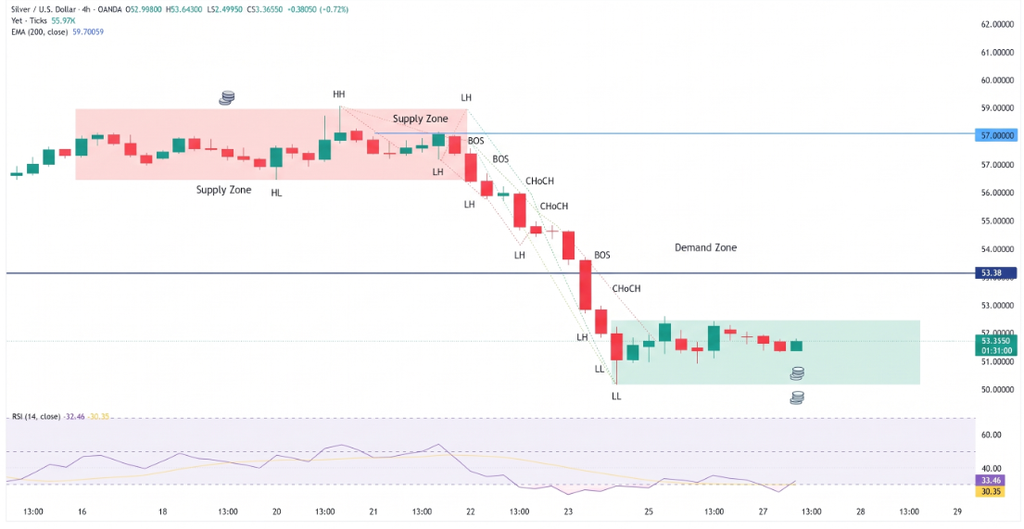
The ADX reading of 42.13 supports the view that the current directional move is powerful, while the bearish SuperTrend at $55.75 marks an important resistance reference. Silver also remains below the Ichimoku Cloud, spanning $54.67–$56.86.
Key technical levels include:
- Support: $52.00, followed by the $51.50–$52.50 potential rebound zone.
- Initial resistance: $54.50–$55.03, where the 20-period moving average and 38.2% Fibonacci retracement converge.
- Higher resistance: $55.74 and $56.45, corresponding to the 50% and 61.8% Fibonacci retracements.
- Bearish invalidation: A sustained recovery above $55.75 would weaken the immediate downside setup.
The reported Average True Range (ATR) of $0.8105 suggests meaningful short-term price fluctuations, making confirmation important before treating a brief move through support as a decisive breakdown.
Conclusion
Silver’s technical outlook remains bearish, but the RSI and MFI readings warn that selling may be stretched. A decisive break below $52.00 could expose lower prices, while a quick recovery above $52.73 would raise the possibility of a short-covering bounce.
For a stronger recovery signal, traders would look for silver to reclaim $55.03 and then challenge $55.75. Until those levels are recovered, rallies may encounter selling pressure. The $52.00–$55.00 range is therefore central to the next move, with the direction of the breakout likely to provide clearer evidence than oversold readings alone.
Sources & Methodology
Primary-source standard: Market-moving facts should link to original data releases, regulator notices, company filings or official project announcements whenever available. Secondary reporting is used for additional context, not as a substitute for original evidence.
Page last reviewed: