Natural gas has rebounded sharply from a recent low of $2.616 to around $3.035 in the supplied technical snapshot, recovering above its 200-period simple moving average at $3.001. The V-shaped recovery signals improving short-term momentum, but the rally is approaching a critical barrier: the 61.8% Fibonacci retracement at $3.059. Traders are weighing whether renewed buying can push prices toward $3.15 or whether resistance will trigger another decline.
Natural Gas Rally Tests $3.059 Resistance
The recovery has shifted the short-term technical picture in favor of buyers. The Moving Average Convergence Divergence (MACD) line has moved to 0.0101, above its signal line at -0.0346, indicating improving momentum. The SuperTrend indicator at $2.836 has also turned into a potential support level, while the latest bullish Marubozu candle points to strong buying during the October 26 session.
However, the rebound is approaching a supply zone where previous selling pressure emerged. The 61.8% Fibonacci retracement, calculated from the $2.616 low and $3.334 swing high, is near $3.059. The upper Bollinger Band at $3.129 adds another resistance reference, with the $3.13–$3.15 area representing a potential obstacle for the rally.
Fundamentals remain important alongside the chart. The US Energy Information Administration reported that working gas in storage reached 3,644 billion cubic feet for the week ended October 16, following a 77 Bcf weekly injection. Inventories were 35 Bcf above the five-year average but 152 Bcf below the year-earlier level. These figures show that storage was broadly near historical norms, while remaining lower than a year ago.
Key Support and Breakout Levels
Natural gas needs a sustained move above $3.059 to strengthen the bullish case. A breakout supported by expanding volume could open the way toward $3.15, followed by $3.25 and $3.33. A failure at resistance, however, could send prices back toward the moving-average cluster around $2.97–$3.00.
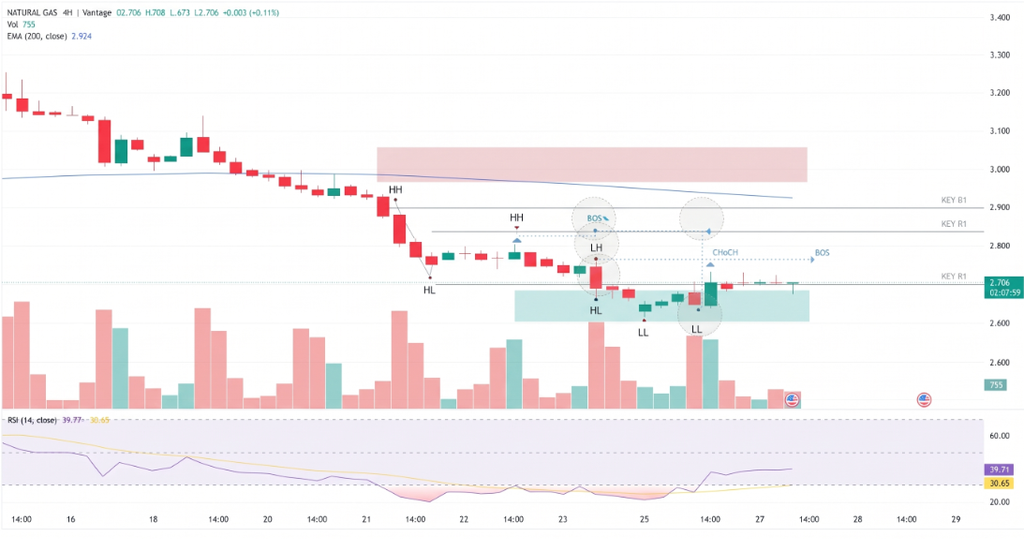
The immediate technical levels are:
- Resistance: $3.059, followed by $3.13–$3.15.
- Initial support: $3.001 at the 200-period moving average.
- Secondary support: $2.97–$2.98, followed by $2.836 at SuperTrend.
- Bullish extension: $3.529, based on the supplied 127.2% Fibonacci extension calculation.
The reported Average True Range of $0.0676, or about 2.23% of price, also indicates that short-term moves can be substantial. Traders may therefore look for a confirmed close above resistance rather than treating a brief intraday spike as a breakout.
Conclusion
Natural gas has regained momentum after its fall to $2.616, but the recovery has not yet cleared the $3.059 Fibonacci barrier. A convincing move above $3.15 would improve the outlook and bring higher targets into view. Conversely, rejection around $3.06–$3.15 could expose $3.00 and $2.836.
For now, the $3.00–$3.10 area remains a zone of uncertainty. The next directional signal will depend on whether buyers can sustain the breakout and whether volume confirms the move.
Sources & Methodology
Primary-source standard: Market-moving facts should link to original data releases, regulator notices, company filings or official project announcements whenever available. Secondary reporting is used for additional context, not as a substitute for original evidence.
Page last reviewed: