
WTI crude oil is showing signs of hesitation near $101.82, where a doji candlestick points to a contest between buyers and sellers. The technical setup remains constructive over the longer term, with prices above the 200-period simple moving average (SMA) at $95.02. However, weakening momentum, declining volume and resistance near $103.53 suggest the rally could face a test. Traders are watching whether oil can break above $104.00 or retreat toward support near $98.50 and the Ichimoku Cloud.
WTI Oil Faces Resistance at $103.53
The latest technical snapshot places West Texas Intermediate (WTI) crude inside an ascending channel, with support near $98.50 and resistance around $103.50–$104.00. The doji formed on October 27 signals indecision rather than a confirmed reversal. Its significance will depend on the next candles and whether trading volume expands as prices approach either boundary.
The broader market backdrop remains sensitive to developments in the Middle East. Reuters reported on October 27 that WTI recovered from earlier losses as diplomatic efforts involving regional governments offered some hope of easing tensions, while renewed Houthi attacks on Saudi Arabia kept supply concerns alive. These competing forces can produce sharp price swings as traders reassess the risk of disruptions to crude shipments.
The WTI crude oil market therefore faces both technical and fundamental uncertainty. A sustained move above $104.00 would weaken the immediate bearish case, while a failure near $103.50 could leave the market vulnerable to profit-taking.
Momentum Weakens as Support Comes Into Focus
Several indicators suggest the advance is losing strength. The Moving Average Convergence Divergence (MACD) line at 1.02 sits below its signal line at 1.13, indicating bearish momentum on the timeframe used in the supplied analysis. The Relative Strength Index (RSI) stands at 57.06, above the neutral 50 mark but below overbought territory.
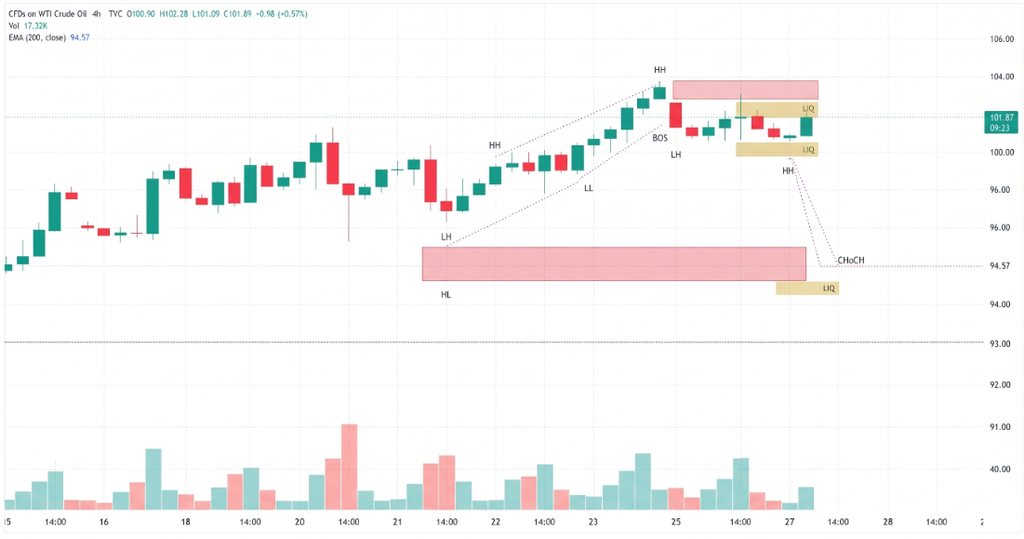
The price remains above the Ichimoku Cloud, which spans $97.81 to $100.85, preserving the broader bullish structure for now. The SuperTrend indicator at $98.48 provides another nearby reference for potential support.
Key levels traders are monitoring include:
- Resistance: $103.00–$104.00, followed by $108.00 if the breakout holds.
- Initial support: $100.45–$98.40, where several technical indicators converge.
- Structural warning: A five-hour close below $97.81 would weaken the bullish setup.
- Deeper retracement: The 50% Fibonacci retracement lies near $95.31, close to the 200-period SMA at $95.02.
The reported average true range (ATR) of $1.59 also indicates that daily price swings can be meaningful, making confirmation important before interpreting a brief move beyond support or resistance.
Conclusion
WTI crude oil remains at a decision point. The doji at $101.82, lower MACD reading and declining volume favor caution, but the price’s position above the long-term moving average and cloud means a bearish reversal is not yet confirmed.
A sustained break above $104.00 could reopen the path toward $108.00. Conversely, rejection near $103.50 followed by a break below $98.48 would put the $97.81 cloud boundary in focus. Until price exits the $100.50–$102.50 consolidation zone, a neutral stance best reflects the mixed technical signals. These levels are scenario markers, not guaranteed outcomes.
Sources & Methodology
Primary-source standard: Market-moving facts should link to original data releases, regulator notices, company filings or official project announcements whenever available. Secondary reporting is used for additional context, not as a substitute for original evidence.
Page last reviewed: