
Dash (DASH) extended its recovery on Tuesday, trading around $54 after a gain of more than 3% in the latest session described in the supplied market data. The cryptocurrency has moved above several key moving averages, while improving derivatives positioning and increased social discussion suggest renewed trader interest. However, the recovery still faces resistance, and market sentiment alone cannot confirm a sustained uptrend. Traders are watching whether DASH can hold above $52 and build enough momentum to challenge the next major technical barrier near $59.72.
Derivatives Data Signals Stronger Demand
Data from CoinGlass shows DASH funding rates turning positive, reaching 0.0041% on Tuesday in the supplied figures. In perpetual futures markets, positive funding generally means traders holding long positions pay those holding short positions. This can reflect stronger demand for bullish exposure, although elevated positive funding may also indicate that long positions are becoming crowded.
Dash’s reported long-to-short ratio stood at 1.02. A reading above one suggests that long positions slightly outnumber short positions within the metric’s measured accounts or positions. It signals a modest bullish tilt, rather than overwhelming conviction.
Social activity provides another measure of market interest. The supplied Santiment data puts DASH social dominance at 0.275% on Tuesday, its highest reading since mid-September. Social dominance measures the share of tracked crypto-related discussion associated with an asset. A rising reading can indicate renewed attention, but it does not establish whether that attention will translate into sustained buying.
Dash is designed primarily as a digital payments network, offering features such as fast transactions and optional privacy protections. Its market performance remains sensitive to broader cryptocurrency sentiment, liquidity and changes in speculative positioning.
DASH Technical Levels Point to Recovery
DASH trades above its 50-day, 100-day and 200-day Exponential Moving Averages (EMAs), located at $52.41, $48.95 and $45.07, respectively, according to the supplied chart analysis. Trading above all three averages supports the recovery structure, though the price must continue holding these levels to preserve that advantage.
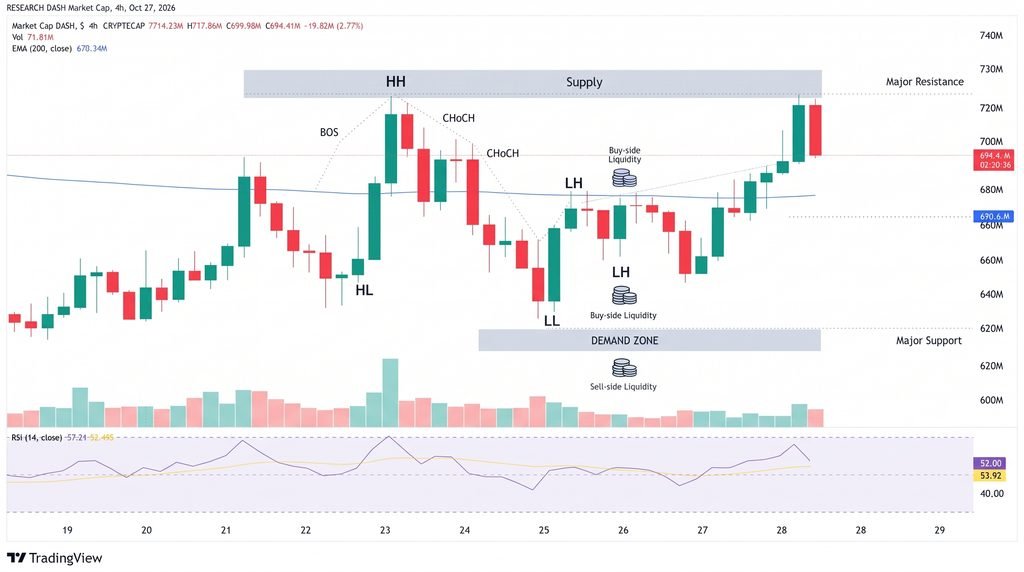
The Relative Strength Index (RSI) near 53 indicates mildly positive momentum without entering traditionally overbought territory. Meanwhile, the Moving Average Convergence Divergence (MACD) indicator is rising above zero, suggesting that upward momentum is improving.
Key levels to monitor include:
- Immediate support: $53.82, the 50% Fibonacci retracement.
- Nearby support zone: $52.41–$52.03.
- Deeper support: $48.95, near the 100-day EMA.
- First major resistance: $59.72, the 38.2% Fibonacci retracement.
- Higher resistance: $67.01, the 23.6% retracement.
A sustained move above $59.72 could open the way toward $67.01. Conversely, a break below $52.03 would weaken the immediate recovery and bring the lower moving averages into focus.
Conclusion
Dash’s recovery is supported by improving technical indicators and signs of stronger trader interest. Yet positive funding rates and increased social activity are supporting signals, not guarantees of further gains. Holding the $52 support region would help preserve the bullish setup, while a convincing break above $59.72 would provide stronger evidence that buyers are regaining control. A failure to hold support could reverse recent progress and expose DASH to a deeper pullback.
Sources & Methodology
Primary-source standard: Market-moving facts should link to original data releases, regulator notices, company filings or official project announcements whenever available. Secondary reporting is used for additional context, not as a substitute for original evidence.
Page last reviewed: