Natural gas prices remain under intense selling pressure, with the five-hour chart showing prices near $2.719, just above a critical support level at $2.616. The Relative Strength Index (RSI) has fallen to 23.03, indicating deeply oversold conditions. While a short-lived recovery is possible, the broader technical structure remains bearish as prices trade below major moving averages. Traders are watching whether buyers can defend the August low or whether another breakdown will expose $2.421, a key downside projection based on Fibonacci analysis.
Natural Gas Bears Target $2.616 Support
The latest price action reflects a sustained decline after natural gas completed a double-top pattern near $3.150. A double top forms when prices fail to break through a similar high twice before falling below support, potentially signalling a shift toward a deeper downtrend.
Natural gas remains below its 20-, 50- and 200-period simple moving averages (SMAs), confirming weakness across multiple timeframes. The Moving Average Convergence Divergence (MACD) indicator is also negative, with its reading at -0.102 compared with a signal line of -0.091. This configuration suggests that sellers continue to control momentum.
The immediate technical focus is the $2.616 low, which represents a major historical support zone. A decisive move below that level could increase selling pressure and expose $2.500, followed by $2.421, the 127.2% Fibonacci extension target.
However, technical projections are not guaranteed outcomes. A confirmed breakdown would need to be assessed alongside trading volume and subsequent price action.
Oversold RSI Raises Rebound Risk
The 14-period Relative Strength Index stands at 23.03, well below the conventional 30 threshold for oversold conditions. Such a reading can indicate that selling has become unusually intense, increasing the possibility of short-covering and temporary buying interest.
Natural gas is also trading near the lower Bollinger Band around $2.65. Prices extending below this band may experience a corrective rebound, although the signal alone does not establish that a bottom has formed.
The main levels to monitor are:
- $2.616: Major support and the immediate downside test.
- $2.500: Intermediate psychological support if the low breaks.
- $2.421: Deeper bearish target from Fibonacci analysis.
- $2.780–$2.850: Potential resistance during a recovery.
Broader market fundamentals also matter. US natural gas futures have recently faced pressure from milder weather forecasts and reduced expectations for near-term heating demand. On October 22, the US Energy Information Administration reported a 77-billion-cubic-foot weekly storage injection, taking inventories to 3.644 trillion cubic feet. The increase matched market expectations and left stocks 152 billion cubic feet below year-earlier levels
Natural Gas Forecast: Two Scenarios
The bearish outlook would strengthen if natural gas breaks below $2.616 with sustained selling pressure. Such a move could open the way toward $2.500 and $2.421.
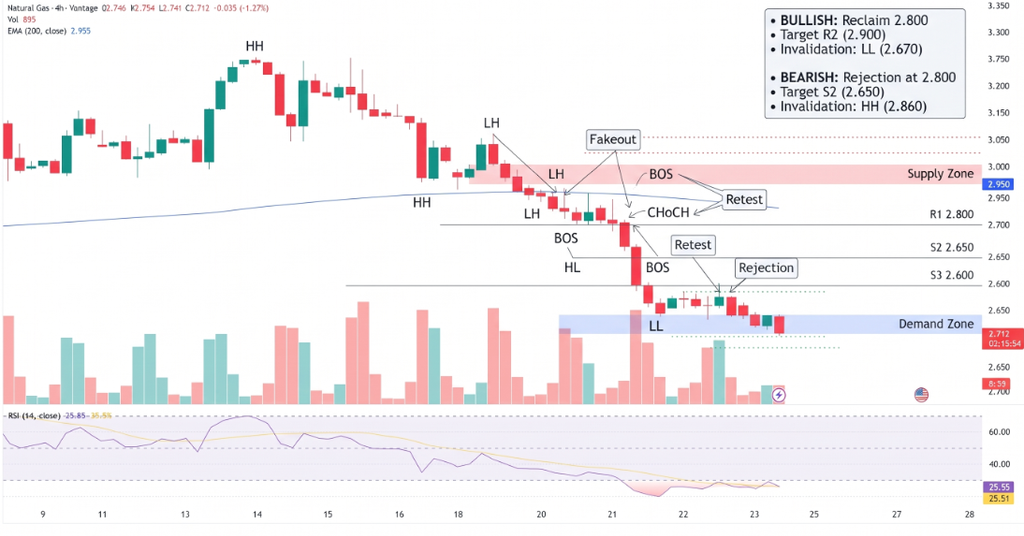
Natural gas Price Chart – Source: Tradingview
Conversely, a sustained rebound accompanied by stronger buying volume could signal that sellers are losing momentum. A recovery toward $2.780–$2.850 would provide an initial test of overhead resistance, but prices would need to regain key moving averages to improve the broader outlook.
Conclusion
Natural gas remains vulnerable to further losses despite deeply oversold momentum. The $2.616 support level is critical: a breakdown could expose lower targets, while a successful defence may trigger a sharp but temporary rebound. Traders should watch price confirmation, volume and weather-driven demand rather than treating the RSI reading alone as a buy signal.
Sources & Methodology
Primary-source standard: Market-moving facts should link to original data releases, regulator notices, company filings or official project announcements whenever available. Secondary reporting is used for additional context, not as a substitute for original evidence.
Page last reviewed: