
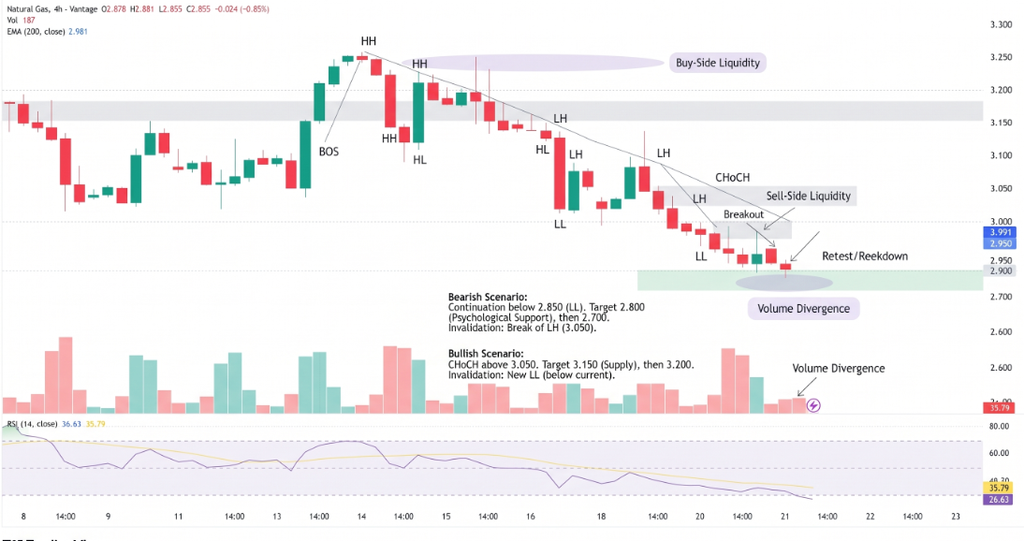
Natural gas prices have plunged to $2.95 on the five-hour chart, placing the market at a critical technical level as selling pressure intensifies. The Money Flow Index (MFI) has fallen to 3.38, while the Relative Strength Index (RSI) stands at 30.3, indicating exceptionally weak momentum. A completed head-and-shoulders pattern reinforces the bearish outlook, but a doji candle near historical support raises the possibility of a short-term rebound. Traders are watching whether buyers can defend $2.95 or whether another breakdown will extend the decline.
Natural Gas Tests Critical $2.95 Support
The latest decline has brought Natural Gas to a significant support area on the five-hour chart. The $2.95 level aligns with historical price support and a trendline tested four times, making it an important point for determining the next move.
Momentum indicators remain firmly bearish. The MFI, which combines price and trading volume to assess buying and selling pressure, has dropped to 3.38. Meanwhile, the RSI is approaching the conventional oversold threshold of 30. The MACD also remains deep in negative territory, suggesting that sellers retain control.
Natural gas is trading 4.09% below its 20-period simple moving average (SMA), highlighting the strength of the recent decline. Such an extended move can increase the likelihood of a corrective rebound, although oversold readings alone do not confirm a market bottom.
Bearish Signals Clash With Rebound Risks
The completed head-and-shoulders pattern supports the bearish case, while the doji candle near $2.95 suggests that buyers and sellers are temporarily reaching an impasse. The next confirmed price move could determine whether the market resumes its decline or attempts a recovery.
Key technical levels define the immediate trading outlook:
- $2.95: Critical support; a confirmed break could attract further selling.
- $2.98: The 50% Fibonacci retracement level and initial resistance.
- $2.89: The 61.8% Fibonacci level and potential lower support.
- $3.08: Upper boundary of the immediate no-trade zone.
- $3.11: A close above this level would weaken the current bearish scenario.
The SuperTrend and Ichimoku Cloud remain bearish, making a sustained recovery more difficult. A move above $3.08 would provide an initial sign of improving momentum, while a close above $3.11 would offer stronger evidence that sellers are losing control.
Natural Gas Outlook: What Comes Next?
The immediate outlook remains bearish while prices stay below resistance, but the exceptionally low MFI and proximity to support increase the risk of a sharp countertrend move. A brief recovery would not necessarily reverse the broader downtrend; confirmation would require improving momentum and sustained price strength.
Fundamental factors also matter. U.S. natural gas prices respond to weather forecasts, production, storage inventories and liquefied natural gas exports, according to the U.S. Energy Information Administration. Changes in expected heating demand or supply conditions can amplify price movements around technical levels.
Conclusion
Natural gas stands at a decisive $2.95 threshold. A confirmed breakdown could expose $2.89, while a successful defense may trigger a rebound toward $2.98 and higher resistance. Traders should wait for price confirmation, manage position sizes carefully and avoid treating oversold indicators as an automatic buy signal.
Sources & Methodology
Primary-source standard: Market-moving facts should link to original data releases, regulator notices, company filings or official project announcements whenever available. Secondary reporting is used for additional context, not as a substitute for original evidence.
Page last reviewed: