Natural gas prices are attempting to recover from oversold conditions, but the rebound is approaching a technical barrier that could determine the market’s next move. The supplied chart levels place resistance near $3.037–$3.040, where the 50-period simple moving average (SMA) and broader trend signals could limit further gains. A sustained break above this area would strengthen the bullish case, while rejection could expose the market to another decline toward $2.758 and $2.620. The immediate outlook remains neutral between $2.950 and $3.037.
Natural Gas Rally Faces Key Resistance
The recovery has taken prices back toward a cluster of moving averages and Fibonacci levels. The most important near-term test is the 50-period SMA at $3.037, followed by the 50% Fibonacci retracement zone around $2.977–$2.997 identified in the supplied chart. These levels can act as resistance when sellers defend a previous decline, although technical indicators alone cannot confirm a reversal.
A market rebound after oversold conditions can trigger short covering as traders who bet on lower prices close positions. That buying can accelerate gains temporarily without ending the broader downtrend. The central question is whether buyers can sustain momentum beyond resistance rather than merely push prices into it.
Recent technical data from Investing.com also showed natural gas trading around $3.01 on October 26, with the 200-period simple moving average near $3.025 in its displayed indicator set. These readings vary by chart timeframe and contract, so they should not be treated as identical to the supplied five-hour setup.
Key Bullish and Bearish Price Levels
The next move depends on how natural gas behaves around the $3.00–$3.04 resistance area. A five-hour close above the 50-period SMA near $3.037 would offer stronger evidence that the recovery is extending. A pullback that holds near $2.892 could also support an aggressive bullish setup, but neither signal guarantees a continued rally.
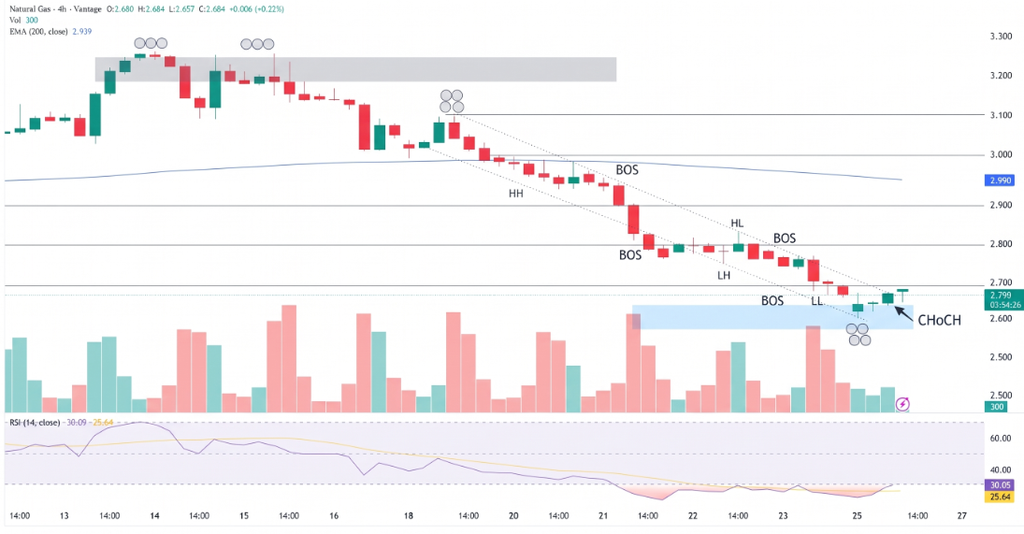
Key levels from the supplied trading plan include:
- Resistance: $3.037–$3.040, followed by $3.145.
- Bullish targets: $3.165, $3.268 and $3.334.
- Support: $2.892, then $2.834 and $2.758.
- Lower downside target: $2.620 if selling pressure returns.
- Neutral zone: $2.950–$3.037 while price remains between nearby support and resistance.
The bearish case would strengthen if prices fail at the 50-period SMA and then fall below $2.950, particularly if a five-hour candle closes below the volume-weighted average price (VWAP). Traders should also monitor the relative strength index (RSI): a move back below 50 would suggest that bullish momentum is weakening.
Conclusion
Natural gas is recovering, but the rebound has not yet established a durable bullish reversal. A sustained move above $3.037–$3.040 would improve the outlook toward $3.165 and higher targets. Rejection at resistance, followed by a break below $2.950, would leave $2.834 and $2.758 exposed. Until price confirms a direction, the $2.950–$3.037 range remains a zone of elevated uncertainty. Traders should size positions carefully and define risk before entering.
Sources & Methodology
Primary-source standard: Market-moving facts should link to original data releases, regulator notices, company filings or official project announcements whenever available. Secondary reporting is used for additional context, not as a substitute for original evidence.
Page last reviewed: