Natural gas prices are consolidating near $2.907, with traders watching whether the market can defend the key 61.8% Fibonacci retracement at $2.891. The technical picture remains mixed: the longer-term SuperTrend indicator points upward, but short-term moving averages and MACD signal continued selling pressure. A developing bear flag adds to downside concerns, although the pattern has not been confirmed. The next decisive move may depend on whether buyers defend support or sellers force a break below the recent trading range.
Natural gas faces conflicting signals
The supplied technical snapshot shows natural gas trading below its 20-period Simple Moving Average (SMA) at $2.920 and its 50-period SMA at $2.913. The price also remains beneath the 200-period SMA at $2.998, indicating that the market has yet to regain its longer-term moving-average benchmark.
Momentum readings offer little evidence of a strong recovery. The Relative Strength Index (RSI) stands at 49.01, close to the neutral 50 mark. Meanwhile, the Moving Average Convergence Divergence (MACD) line is at -0.0067, below its signal line at -0.0047. This configuration indicates that bearish momentum remains active.
The Ichimoku cloud between $2.902 and $2.916 is another important technical area. Natural gas is testing this zone, which could determine whether the market stabilizes or resumes its decline. In contrast, the SuperTrend remains positive near $2.772, providing a lower reference for longer-term support.
The Average True Range (ATR) is 0.0725, or approximately 2.49% of the quoted price. This indicates that price fluctuations remain meaningful even as trading volume declines and the market consolidates.
$2.891 Fibonacci support in focus
The 61.8% Fibonacci retracement sits at $2.891, calculated from the move between $2.616 and $3.334. This level is particularly important because it coincides with the broader Ichimoku support area.
A developing bear flag near $2.900 is estimated to be around 80% complete. The pattern typically forms when prices consolidate after a sharp decline, before potentially continuing lower. However, traders generally seek a confirmed support break before treating the formation as a reliable bearish signal.
A doji candlestick near $2.907 on November 2 also reflects market indecision. Declining volume reinforces the view that neither buyers nor sellers have established decisive control.
Key technical levels include:
- Immediate support: $2.891.
- Lower support: $2.830.
- Major trend support: $2.772.
- First resistance: $2.920–$2.998.
- Major resistance: $3.050.
- Bullish invalidation: $3.050.
- Bearish invalidation: $2.772.
Natural gas forecast: Breakout ahead?
The immediate outlook remains neutral while prices trade between $2.850 and $2.950. A sustained break below $2.891 would strengthen the bear-flag scenario and put $2.830 under pressure. Further losses could bring the SuperTrend support at $2.772 into focus.
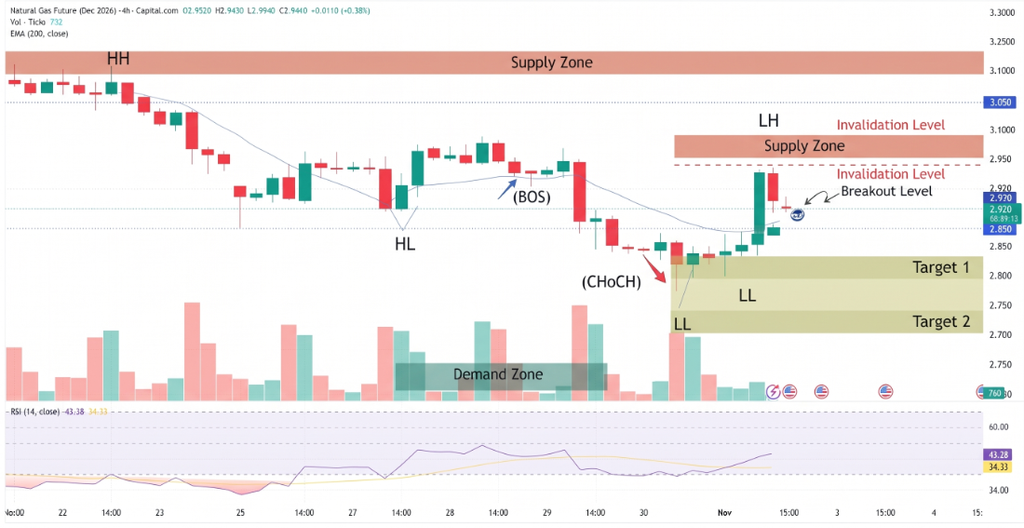
On the upside, a recovery above $2.950 would improve short-term sentiment, although the $2.998 moving average and $3.050 resistance remain significant obstacles. A move above $3.050 would provide stronger evidence that the bearish setup has weakened.
Conclusion
Natural gas remains caught between important support and resistance levels, with the $2.891 Fibonacci retracement serving as the immediate test. The bear flag and negative MACD favor caution, but neutral RSI and positive SuperTrend support argue against assuming an immediate breakdown. A confirmed move below $2.891 could expose $2.830 and $2.772, while a recovery above $3.050 would invalidate the bearish setup. Until either boundary gives way, consolidation remains the most defensible near-term outlook.
Sources & Methodology
Primary-source standard: Market-moving facts should link to original data releases, regulator notices, company filings or official project announcements whenever available. Secondary reporting is used for additional context, not as a substitute for original evidence.
Page last reviewed: