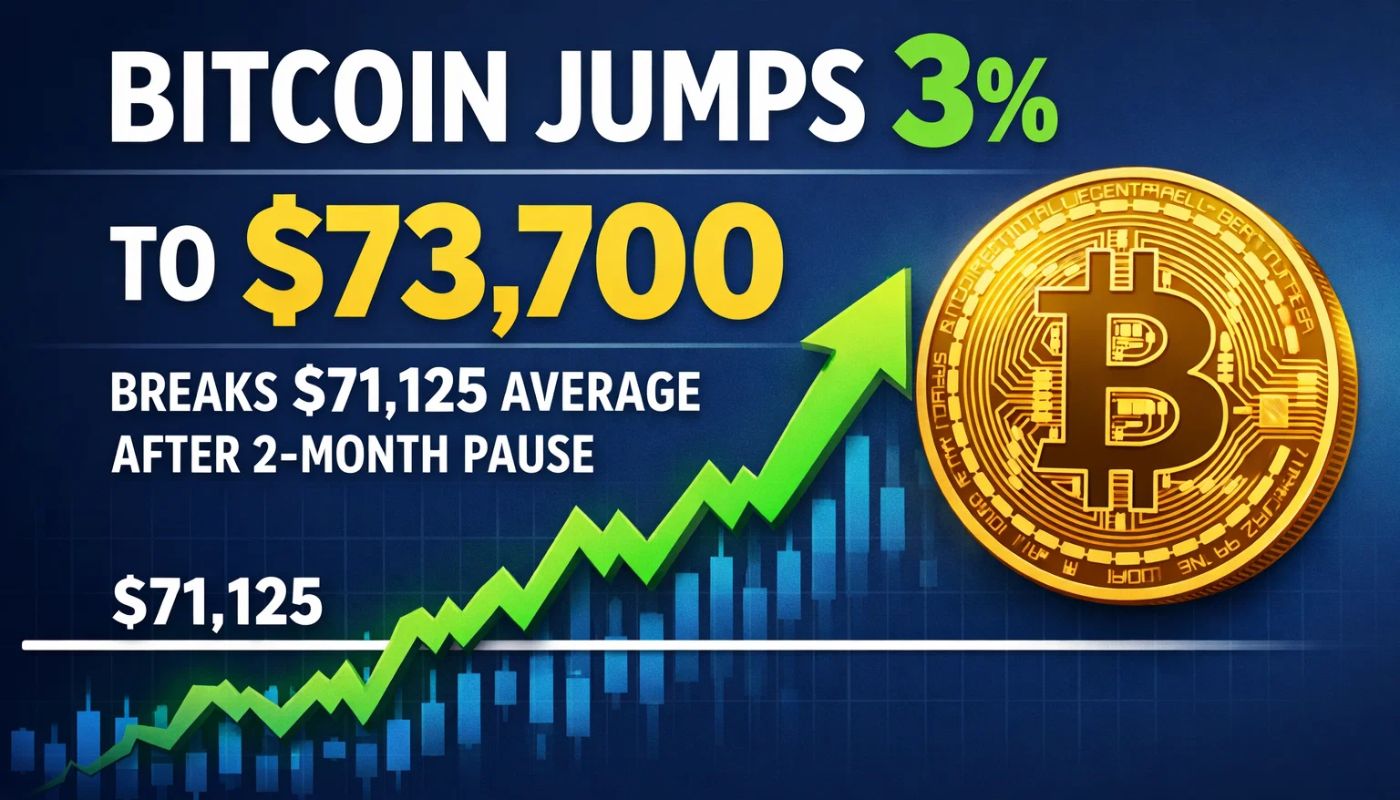
The price of Bitcoin moved above an important technical level this week, signaling that bullish momentum may be building again in the cryptocurrency market. Bitcoin rose more than 3% in 24 hours, reaching about $73,700, and climbed above its 50-day moving average of $71,125 for the first time in nearly two months.
In financial markets, the 50-day moving average is widely used by traders to measure the medium-term trend. When an asset’s price moves above this line, analysts often interpret it as a sign that buyers are gaining control.
Bitcoin’s latest rally came during a period of global market uncertainty, including geopolitical tensions and volatility in stock markets, particularly across Asia. Despite those challenges, the digital asset maintained steady demand and gradually moved higher.
Market analysts say a decisive move above the 50-day average could mark a potential turning point for Bitcoin’s price direction. However, technical signals alone do not guarantee that a strong rally will continue.
Alex Kuptsikevich, a senior analyst at FxPro, noted that the 50-day moving average is one of the most closely monitored indicators in trading. According to him, a sustained move above this level could strengthen the medium-term outlook for Bitcoin.
Why the 50-Day Average Matters
The 50-day moving average works like a simple guide that shows the average price of an asset over the past 50 days. Traders use it to understand whether the market is trending up or down.
When Bitcoin trades above this level, it usually suggests stronger buying momentum. When the price falls below it, the market may be weakening.
Some key numbers shaping the current Bitcoin outlook include:
- Bitcoin price: about $73,700
- 24-hour gain: more than 3%
- 50-day moving average: roughly $71,125
- Previous breakout (January): price rose about 8%
However, history shows that these signals do not always lead to a long rally. Earlier this year, Bitcoin also moved above its 50-day average in January, triggering an 8% increase in price. That upward momentum lasted about two weeks before sellers returned and pushed prices lower again.
Because of this mixed track record, analysts recommend watching other indicators and market conditions alongside technical signals.
$75,000 Could Bring More Volatility
If Bitcoin continues climbing, the next important level traders are watching is $75,000. This price zone is significant because market-making firms—companies that provide liquidity to exchanges—hold large positions around this level.
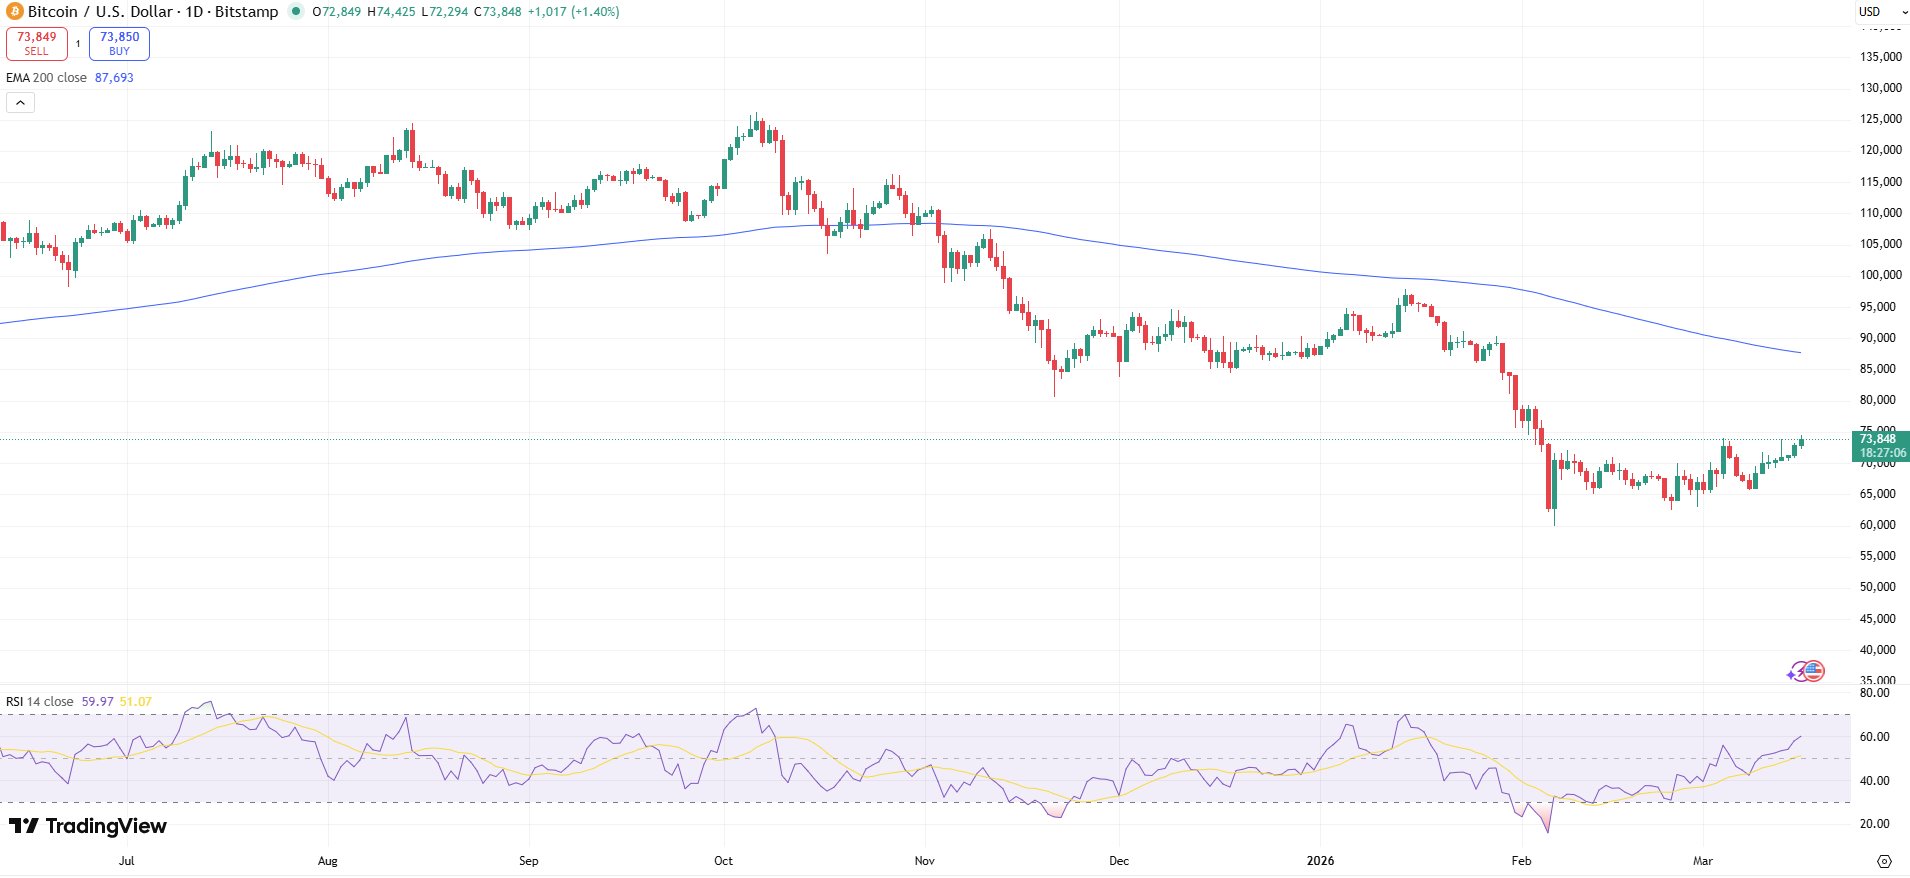
These firms often manage short gamma positions, meaning they may need to buy Bitcoin if the price keeps rising. When this happens, it can increase trading activity and push volatility higher.
In simple terms, as Bitcoin approaches $75,000:
- Market makers may buy more Bitcoin to balance risk
- Increased buying can accelerate price swings
- Trading activity across exchanges may rise sharply
For now, Bitcoin’s move above the 50-day average suggests improving momentum, but traders remain cautious. Whether the cryptocurrency can sustain its climb will depend on broader market conditions, investor demand, and how the market reacts near the $75,000 threshold.