
Dogecoin (DOGE) is facing renewed selling pressure as the meme coin trades around $0.090 on Wednesday. DOGE has fallen more than 5% this week, with cryptocurrency derivatives positioning turning increasingly defensive. CoinGlass data shows the long-to-short ratio at 0.68, its lowest level in more than a month, indicating that short positioning has overtaken long exposure. At the same time, technical indicators are losing strength, leaving DOGE vulnerable to another leg lower if key support levels fail.
Dogecoin Derivatives Turn Bearish
The latest Dogecoin derivatives data points to a clear deterioration in trader sentiment. CoinGlass’ long-to-short ratio has fallen to 0.68, meaning short positions outweigh long positions among the tracked accounts. A reading below 1 generally indicates that bearish positioning is dominant.
CryptoQuant data adds to the caution. Spot and futures conditions indicate an overheated market, while large whale activity in futures is tilted toward selling. That combination suggests that larger participants are adding pressure rather than providing strong support for a near-term recovery.
DOGE has also struggled to maintain the gains that carried it toward the $0.10 area in late September. Historical Dogecoin price data shows the token reached $0.1058 on September 22 before retreating toward the $0.09 region.
Key market signals include:
- Long-to-short ratio: 0.68
- Current price area: Around $0.090
- Immediate technical support: Near $0.088
- Major psychological resistance: $0.100
DOGE Technical Outlook Weakens
The technical structure has become more fragile as DOGE trades below its 200-day exponential moving average around $0.093. Holding below this widely followed trend indicator keeps the short-term bias tilted lower.
However, the decline has not yet completely damaged the broader structure. The 50-day EMA near $0.088 and 100-day EMA around $0.086 provide successive support levels. CoinMarketCap analysis also identifies the $0.0887 area, corresponding with a 61.8% Fibonacci retracement, as an important level for the next move. A sustained break could expose the $0.086 region.
Momentum indicators reinforce the cautious outlook. The Relative Strength Index (RSI) near 48 indicates that buying pressure is no longer dominant, while a slightly negative MACD suggests momentum has weakened as DOGE consolidates below recent highs.
A decisive daily close below the $0.085 area would increase the risk of a deeper correction toward the $0.070 horizontal support zone.
DOGE Needs $0.093 Reclaim
For bulls, the first priority is reclaiming the 200-day EMA near $0.093. A sustained move above that level would weaken the immediate bearish setup and could encourage buyers to challenge the $0.10 psychological barrier.
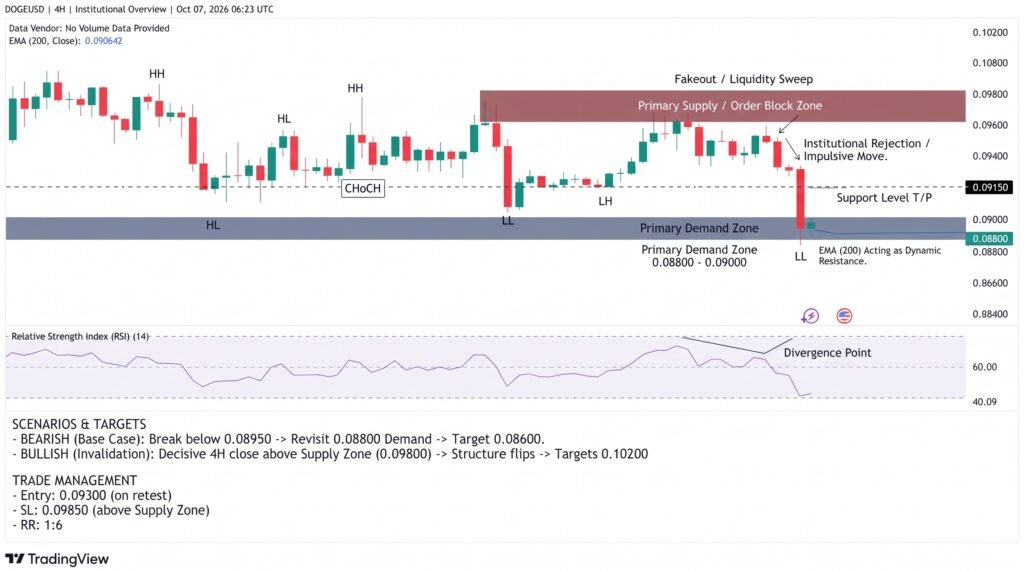
The next major resistance sits near $0.102, an area where previous selling pressure could return. DOGE would need stronger trading volume and improving momentum to convincingly break through that zone.
Conversely, failure to hold the $0.088-$0.086 support band would strengthen the bearish case. Recent Dogecoin historical data shows DOGE has experienced sharp swings, including a 14.4% daily gain on September 21 followed by a 7.7% decline on September 23, highlighting the token’s high volatility.
Conclusion
The Dogecoin price forecast remains cautious while DOGE trades below the $0.093 200-day EMA and derivatives positioning favors sellers. The $0.088-$0.086 zone is now critical for limiting further losses. A break below that area could shift attention toward $0.085 and potentially $0.070. Conversely, reclaiming $0.093 would improve the technical picture and put $0.10-$0.102 back in focus.
Sources & Methodology
Primary-source standard: Market-moving facts should link to original data releases, regulator notices, company filings or official project announcements whenever available. Secondary reporting is used for additional context, not as a substitute for original evidence.
Page last reviewed: