
Ethereum (ETH) fell below $2,500 on Thursday, extending its decline for a third consecutive session as rising oil prices and US Treasury yields weakened demand for cryptocurrencies. The 10-year Treasury yield reached 5.35%, its highest level in 24 years, while the 30-year yield climbed above 5.70%. Although both yields later retreated following President Donald Trump’s comments about Iran, persistent institutional outflows and rising exchange reserves continued to weigh on ETH. US spot Ethereum exchange-traded funds (ETFs) recorded seven consecutive sessions of net outflows totaling approximately $565 million, adding to the market’s selling pressure.
Treasury Yields Pressure Ethereum
Rising bond yields have increased competition for capital as investors reassess exposure to risk-sensitive assets. Higher returns on government debt can make cryptocurrencies less attractive, particularly when uncertainty surrounding inflation and interest rates increases.
The latest pressure followed the release of the Federal Reserve’s September meeting minutes, which indicated that officials continued to consider further monetary tightening. The possibility of additional rate increases has kept investors cautious about assets that can experience sharp price swings.
According to the supplied market report, Treasury yields eased to 5.23% for the 10-year note and 5.60% for the 30-year bond after Trump said the United States would not attack Iran before the November 3 midterm elections.
Despite that retreat, demand for Ethereum remained weak. Data from SoSoValue showed $160.7 million in net withdrawals from US spot ETH ETFs on Wednesday, bringing cumulative outflows over seven sessions to roughly $565 million.
ETF Outflows and Exchange Reserves Rise
Institutional withdrawals have coincided with an increase in the amount of Ethereum held on cryptocurrency exchanges. Exchange reserves rose by approximately 132,000 ETH since Monday and 233,000 ETH over two weeks, according to the supplied report.
Higher exchange balances can indicate that investors are preparing to sell, although deposits alone do not confirm that selling will follow.
Selling pressure also extended across wallet groups:
- Large holders: Wallets containing 10,000–100,000 ETH reduced their collective balances by approximately 151,000 ETH.
- Retail and mid-sized holders: Wallets holding 100–10,000 ETH shed a combined 276,000 ETH.
- Derivatives traders: CoinGlass liquidation data showed $351.6 million in ETH positions liquidated over 24 hours, including $294.6 million in long positions and $57 million in short positions.
Liquidations occur when leveraged positions are forcibly closed after losses breach exchange requirements. The concentration in long liquidations indicates that traders betting on rising prices absorbed most of the reported losses, potentially amplifying the decline.
ETH Technical Outlook: Key Levels
Ethereum’s daily chart has weakened after the price slipped below its 20-day and 50-day exponential moving averages (EMAs), positioned near $2,631 and $2,502, respectively.
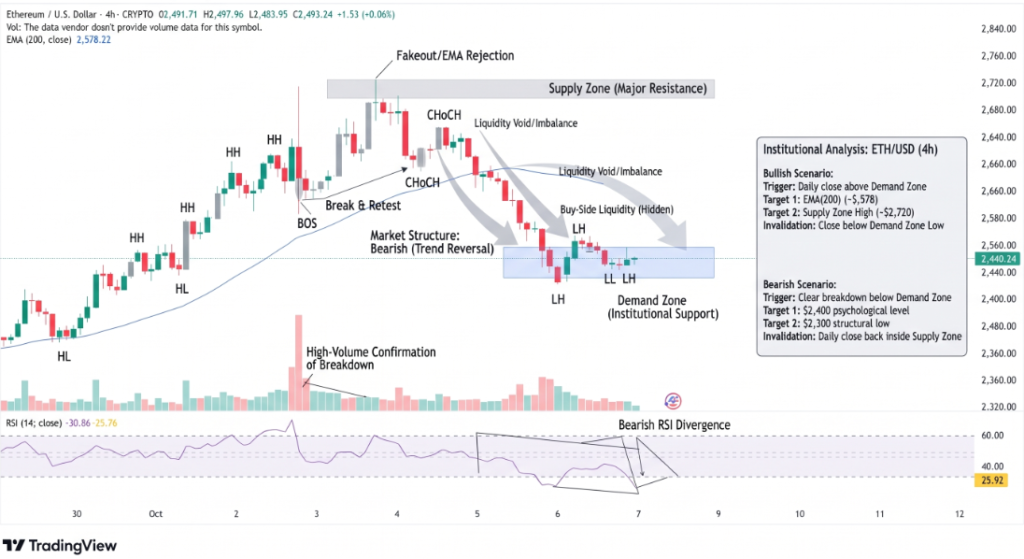
The 14-day Relative Strength Index (RSI) stood at 37, indicating weak momentum. The Stochastic indicator near 18 pointed to oversold conditions, although neither reading guarantees an immediate recovery.
Key levels traders are monitoring include:
- Support: $2,355, followed by the 100-day EMA near $2,338.
- Lower targets: $2,204 and $1,972 if support breaks.
- Immediate resistance: $2,548, followed by $2,636 and $2,781.
A daily close below the $2,355–$2,338 support zone would increase the risk of further losses. Conversely, reclaiming $2,548 could signal an initial improvement in short-term momentum.
Conclusion
Ethereum faces pressure from declining ETF demand, rising exchange balances and a challenging macroeconomic environment. The $2,355–$2,338 area is an important support zone, while $2,548 represents the first major recovery hurdle. Whether ETH stabilizes or extends its decline will depend on investor flows, Treasury yields and its ability to regain lost technical levels.
Sources & Methodology
Primary-source standard: Market-moving facts should link to original data releases, regulator notices, company filings or official project announcements whenever available. Secondary reporting is used for additional context, not as a substitute for original evidence.
Page last reviewed: