
Ethereum (ETH) climbed back above $2,700 after buyers defended the cryptocurrency’s realized price near $2,310, despite recent pressure from the failed U.S. Clarity Act vote and the latest Federal Reserve rate decision. ETH had fallen below $2,400 after the Sept. 15 Senate vote but recovered as demand emerged near the on-chain cost-basis level. The Senate vote failed to advance the Clarity Act, with the measure receiving 49 votes in favor and 50 against, below the 60 votes required.
ETH Buyers Defend Key Price Level
The recovery suggests that some investors viewed the decline toward the realized price as an opportunity to accumulate rather than exit. The realized price represents the average price at which coins currently held on-chain were last moved, making it an important measure of the market’s aggregate cost basis.
ETH’s rebound has occurred despite mixed signals from active traders. Exchange netflows have recently favored deposits over withdrawals, which can indicate that some holders are moving coins toward exchanges where they could potentially be sold.
At the same time, U.S. spot Ethereum ETFs provided a more supportive signal. The products recorded $143.8 million in net inflows on Sept. 18, ending the week with a strong daily inflow even though the full week still recorded net outflows.
- ETH realized price: about $2,310
- Recent recovery zone: above $2,700
- Sept. 18 ETF inflows: $143.8 million
- Immediate resistance: $2,786
ETF Flows and Traders Send Mixed Signals
The Coinbase Premium Index has also started recovering after declining for several sessions. The indicator tracks the price difference between Coinbase and other major exchanges and is often used as a gauge of U.S. investor demand. However, the index remains negative, showing that the recovery in U.S. buying interest has not fully reversed recent weakness.
Derivatives data are similarly divided. The Taker Buy Sell Ratio had been improving over the weekend, with its seven-day moving average moving into positive territory. On Monday, however, bearish positioning regained some control, indicating that derivatives traders were becoming more cautious after ETH’s rapid advance.
The broader regulatory backdrop also remains relevant. The Clarity Act’s failure temporarily weakened crypto sentiment, with Ethereum falling below $2,400 after the Senate vote. The subsequent recovery shows that price action has not remained tied solely to the regulatory setback.
$2,786 Caps Ethereum’s Immediate Upside
Ethereum’s daily technical structure remains constructive. ETH is trading above its 20-, 50-, 100- and 200-day Exponential Moving Averages, with the 20-day EMA near $2,537 providing the nearest major trend reference.
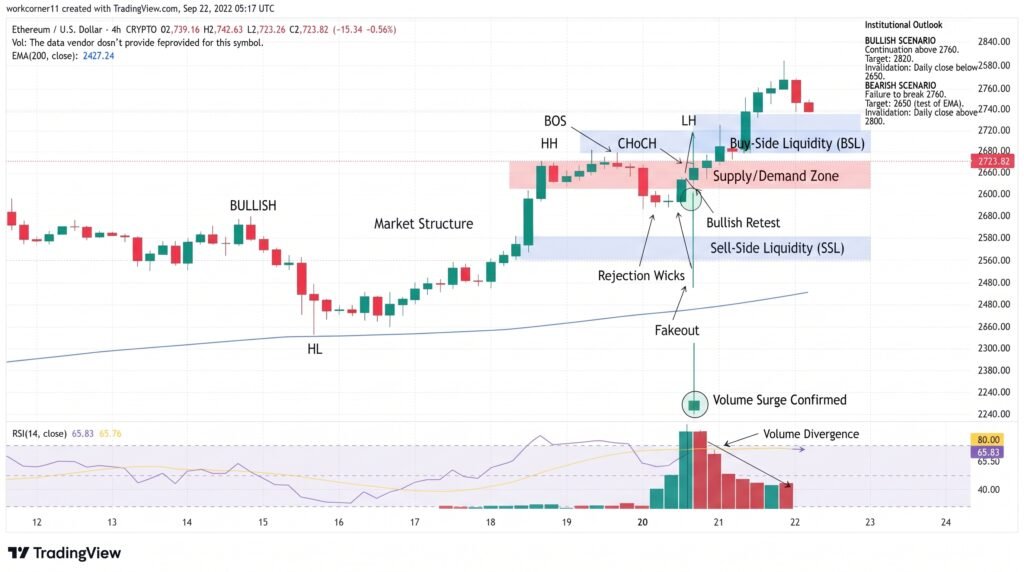
Momentum, however, is becoming stretched. The 14-day RSI is around 71, while the Stochastic Oscillator is near 91. Both readings are in traditionally overbought territory, meaning strong momentum is accompanied by increased pullback risk.
On the upside, $2,786 is the immediate resistance level, followed by $2,894 and $3,177. A sustained move above $2,786 would expose the next resistance zones.
On the downside, $2,626 is the first structural support. Below it, the $2,544-$2,537 area combines horizontal support with the 20-day EMA. Deeper weakness could bring $2,431 into focus, followed by the 50-day EMA near $2,356.
Conclusion
Ethereum’s recovery above $2,700 has restored a constructive short-term structure after buyers defended the $2,310 realized price. ETF flows and improving U.S. investor sentiment provide supportive signals, although exchange deposits and renewed bearish derivatives positioning show that conviction remains mixed. Technically, $2,786 is the key upside barrier, while $2,626 and $2,537 define important downside references. With RSI and Stochastic readings in overbought territory, the next sustained move will depend on whether buying pressure can absorb profit-taking near resistance.
Sources & Methodology
Primary-source standard: Market-moving facts should link to original data releases, regulator notices, company filings or official project announcements whenever available. Secondary reporting is used for additional context, not as a substitute for original evidence.
Page last reviewed: