
- ETH/BTC is testing a potential double-top structure, with resistance around 0.03344 BTC.
- 0.03078 BTC is the key neckline; a confirmed daily close below it could expose the 0.0283 BTC area.
- Large ETH inflows to Binance and weaker relative momentum add short-term pressure, though exchange deposits do not automatically mean selling.
Ethereum is losing ground against Bitcoin, with the ETH/BTC pair near 0.0317 as traders assess a possible bearish reversal on the daily chart. Two failed advances around 0.03344 BTC have created a potential double-top formation, putting the 0.03078 neckline in focus. A confirmed break below that level could extend Ethereum’s relative weakness toward approximately 0.0283 BTC. The technical pressure comes alongside elevated ETH transfers to exchanges and renewed uncertainty over U.S. crypto regulation following the Senate’s failure to advance the CLARITY Act.
ETH/BTC Tests a Bearish Chart Setup
The Ethereum versus Bitcoin chart has developed two similar highs around 0.03344 BTC, one during August and another in September. That structure can be interpreted as a double top, but the pattern is not confirmed simply because two peaks exist. Confirmation generally requires price to break and close below the neckline, which in this setup sits around 0.03078 BTC.
Using the height of the formation as a measured-move guide produces a potential downside objective around 0.0283 BTC. From the current area, that would represent roughly a 10% deterioration in Ethereum’s value relative to Bitcoin.
The alternative scenario remains important. A sustained recovery through 0.03344 BTC would invalidate the double-top structure and indicate that Ethereum is regaining relative strength.
Momentum Fades as Key Support Holds
Momentum indicators also show that ETH’s earlier advantage over Bitcoin has weakened. The daily Relative Strength Index has retreated toward 50 after previously moving above 70. That shift does not independently confirm a bearish trend, but it indicates that the strong momentum behind the earlier ETH/BTC advance has faded.
ETH/BTC is also trading close to its 20-day exponential moving average near 0.03162 BTC. Holding this area would keep the pair above its immediate technical support and could produce another attempt at the 0.03344 resistance zone. A move below the EMA would put greater attention on 0.03078 BTC.
Regulation Adds to Crypto Volatility
The technical weakness follows the U.S. Senate’s September 15 failure to advance the Digital Asset Market Clarity Act. The procedural setback left broader federal crypto market-structure legislation stalled, increasing attention on regulatory action from the SEC and CFTC.
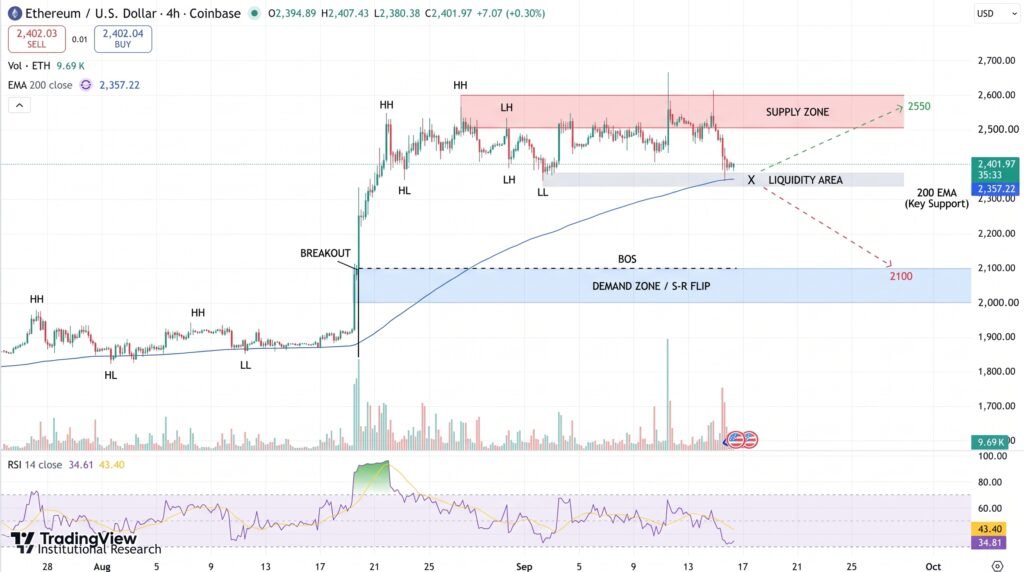
The vote contributed to wider volatility across digital assets and crypto-related equities. In periods of increased uncertainty, changes in relative demand between Bitcoin and Ethereum can have a direct effect on ETH/BTC, making the pair particularly useful for measuring which asset is outperforming.
Binance Inflows Raise Supply Question
Another factor being watched is the amount of Ethereum moving onto centralized exchanges. CryptoQuant data cited in market reports showed approximately 709,400 ETH flowing into Binance on September 11, with several recent sessions also recording unusually large deposits.
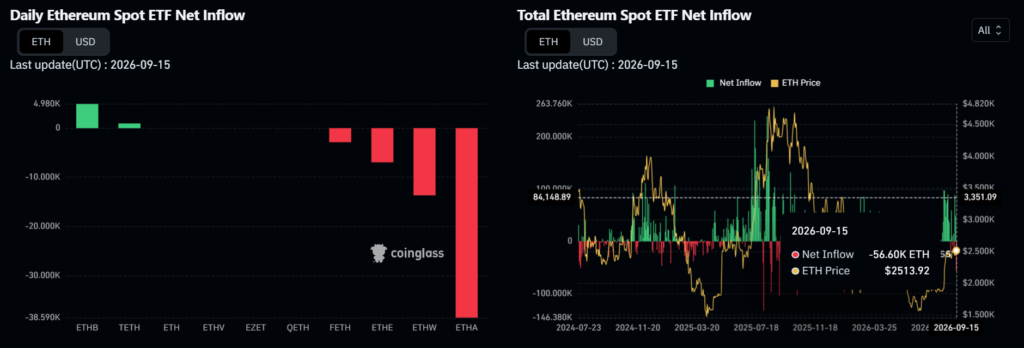
Exchange inflows deserve careful interpretation. Moving ETH onto Binance increases the amount of cryptocurrency readily available for trading, but a deposit does not prove that the owner intends to sell. Funds can also be transferred for derivatives collateral, market making, portfolio restructuring or other trading activity. Still, sustained unusually high inflows combined with weakening price momentum could increase short-term volatility.
Conclusion
Ethereum’s relative outlook now centers on a narrow technical range. 0.03078 BTC is the critical downside level, while 0.03344 BTC remains the main resistance separating ETH from renewed relative strength. A confirmed daily close below 0.03078 would complete the proposed double-top pattern and put 0.0283 BTC in focus. Conversely, holding the 20-day EMA and eventually breaking 0.03344 would invalidate the bearish formation. Until either boundary breaks decisively, the chart signals weakening Ethereum momentum against Bitcoin rather than a confirmed 10% decline.
Sources & Methodology
Primary-source standard: Market-moving facts should link to original data releases, regulator notices, company filings or official project announcements whenever available. Secondary reporting is used for additional context, not as a substitute for original evidence.
Page last reviewed: