
What Is Forex Market Analysis?
Forex market analysis is the process of turning economic information, price action and trader positioning into a structured view of a currency pair. The goal is not to predict every price move. It is to build a scenario, define what would confirm it, and know what would prove it wrong.
The market is large enough that no single signal explains everything. According to the Bank for International Settlements, global over-the-counter FX turnover reached about $9.5 trillion per day in April 2025. That market includes banks, asset managers, hedge funds, corporations, central banks and other participants, each trading for different reasons.
A EUR/USD rally, for example, can reflect a weaker dollar, a stronger euro, a change in Federal Reserve expectations, a change in ECB expectations, a technical breakout, crowded positioning being unwound — or several of these forces at once. Good analysis separates those layers instead of assuming one indicator explains the entire move.
The Three Types of Forex Analysis
| Method | Main question | Typical tools | Best use |
|---|---|---|---|
| Fundamental | Why might one currency outperform another? | Central banks, rates, inflation, NFP, GDP, PMIs, fiscal/geopolitical news | Macro bias and catalysts |
| Technical | What is price doing and where are the important levels? | Trend, support/resistance, candlesticks, ADX, RSI, MACD, moving averages | Timing, structure, entry, stop and target |
| Sentiment | How is the market positioned? | COT, options, retail positioning, risk appetite | Crowding, confirmation and contrarian context |
1. Fundamental Analysis in Forex
Fundamental analysis studies the economic forces behind exchange rates. Because every currency pair compares two currencies, the analysis is always relative. A strong U.S. economy does not automatically mean EUR/USD must fall if the euro area’s outlook is improving even faster or if the Federal Reserve is turning more dovish than the ECB.
Central Banks and Interest-Rate Expectations
Interest-rate expectations are among the most important currency drivers because they affect the expected return on assets denominated in different currencies. Traders follow the Federal Reserve, European Central Bank, Bank of England, Bank of Japan and other central banks not only for today’s rate decision but for clues about the path ahead.
A rate hike can be bearish if the market expected an even larger hike. A rate cut can be bullish if traders had feared a deeper easing cycle. This is why the first question around any central-bank event should be: what was already priced in?
GDP and Growth: Useful, but Often Backward-Looking
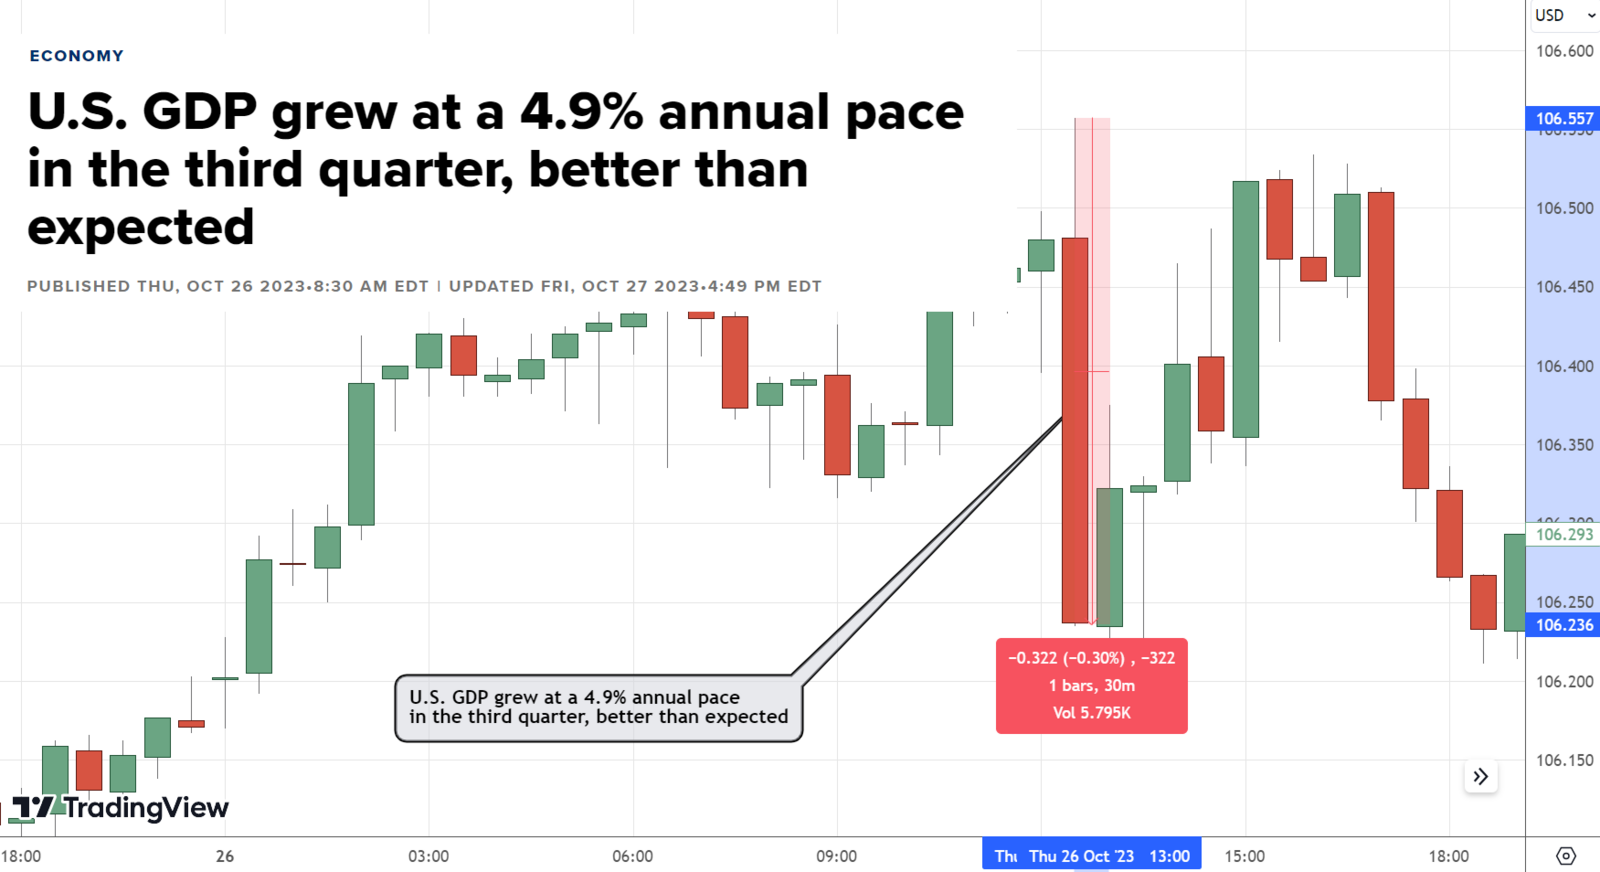
Gross domestic product measures the value of goods and services produced in an economy. Strong growth can support a currency if it changes expected interest rates, investment flows or confidence. But GDP is backward-looking and subject to revision, so traders often combine it with faster indicators such as PMIs, retail sales and industrial data.
Employment: NFP, Unemployment and Wages
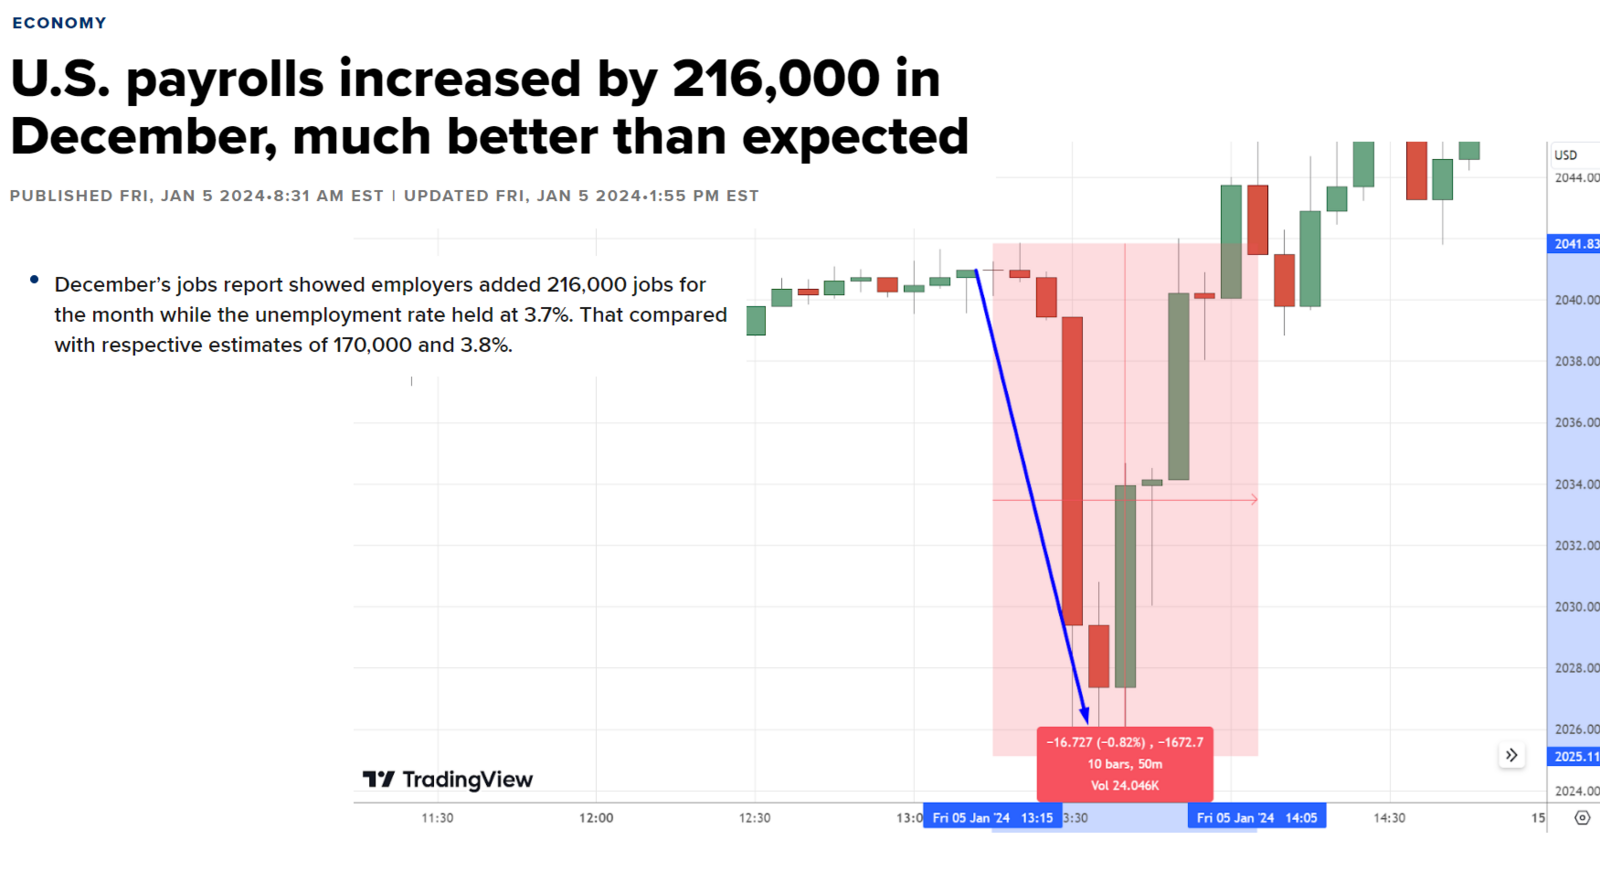
The U.S. Employment Situation is one of the most closely watched forex releases. The BLS payroll survey estimates nonfarm payroll jobs and excludes categories such as farm workers, private-household workers, proprietors, the self-employed and unpaid family workers. Government civilian jobs are included.
The headline payroll number is only part of the release. Traders also watch unemployment, average hourly earnings, participation and revisions. A strong payroll headline can still weaken the dollar if prior months are revised sharply lower or wage growth disappoints.
Inflation: CPI, PCE and the Policy Link
Inflation matters because it can change the expected path of monetary policy. CPI is one of the fastest-moving market catalysts in the United States, while the Federal Reserve’s 2% longer-run inflation goal is measured using the PCE price index.
A hotter-than-expected inflation report can support a currency if traders expect higher rates for longer. But the reaction is never automatic. If the surprise is concentrated in volatile components or the economy is weakening sharply, traders may interpret the same headline differently.
PMIs, Retail Sales, PPI and Other Useful Data
PMIs provide a timely view of business activity; retail sales help gauge consumer demand; PPI can show pipeline price pressure; and measures such as the Employment Cost Index add context on wage inflation. The point is not to trade every release. Focus on the indicators most likely to change the central-bank or growth story for the pair you are analysing.
A Simple Fundamental Analysis Workflow
Compare the two central banks: which one is more hawkish or dovish, and is that gap widening or narrowing?
Check inflation, employment and growth trends for both economies.
Look at the next high-impact releases and the consensus forecasts.
Ask what the market already expects through yields, futures pricing and recent currency moves.
Write a one-sentence macro thesis, then list the event that would invalidate it.
2. Forex Technical Analysis
Technical analysis studies price action rather than trying to calculate an intrinsic value for a currency. It helps answer three practical questions: Is the market trending or ranging? Where are buyers and sellers reacting? Where does the trade idea stop making sense? Indicators can help measure those conditions, but they should not replace price structure.
Start With Market Structure Before Indicators
Before adding RSI or MACD, mark the trend, recent swing highs and lows, support and resistance, and any obvious consolidation. This gives the indicators context.
For example, an RSI reading above 70 means something very different inside a powerful uptrend than it does after price reaches major resistance and prints a failed breakout. The number is the same; the market structure is not.
ADX: Is the Market Trending Strongly?
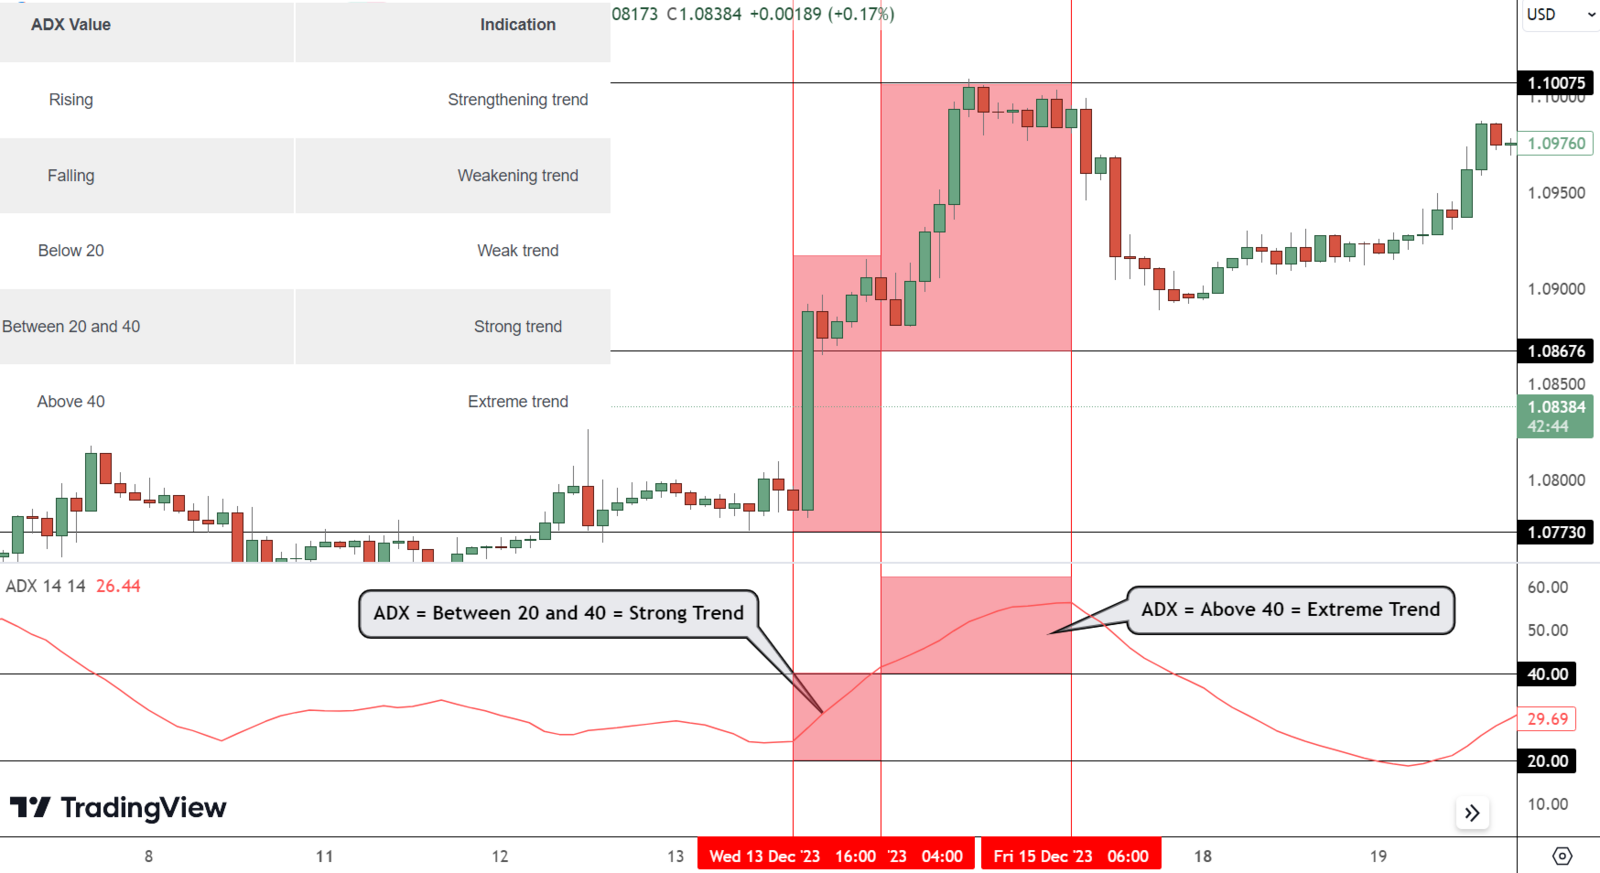
The Average Directional Index measures trend strength rather than direction. Traders often treat readings below roughly 20 as a weak-trend environment and higher readings as evidence that directional movement is strengthening. These are reference zones, not hard rules. ADX is best used alongside price direction or the +DI/-DI components.
OBV: A Useful Idea With an Important Forex Limitation
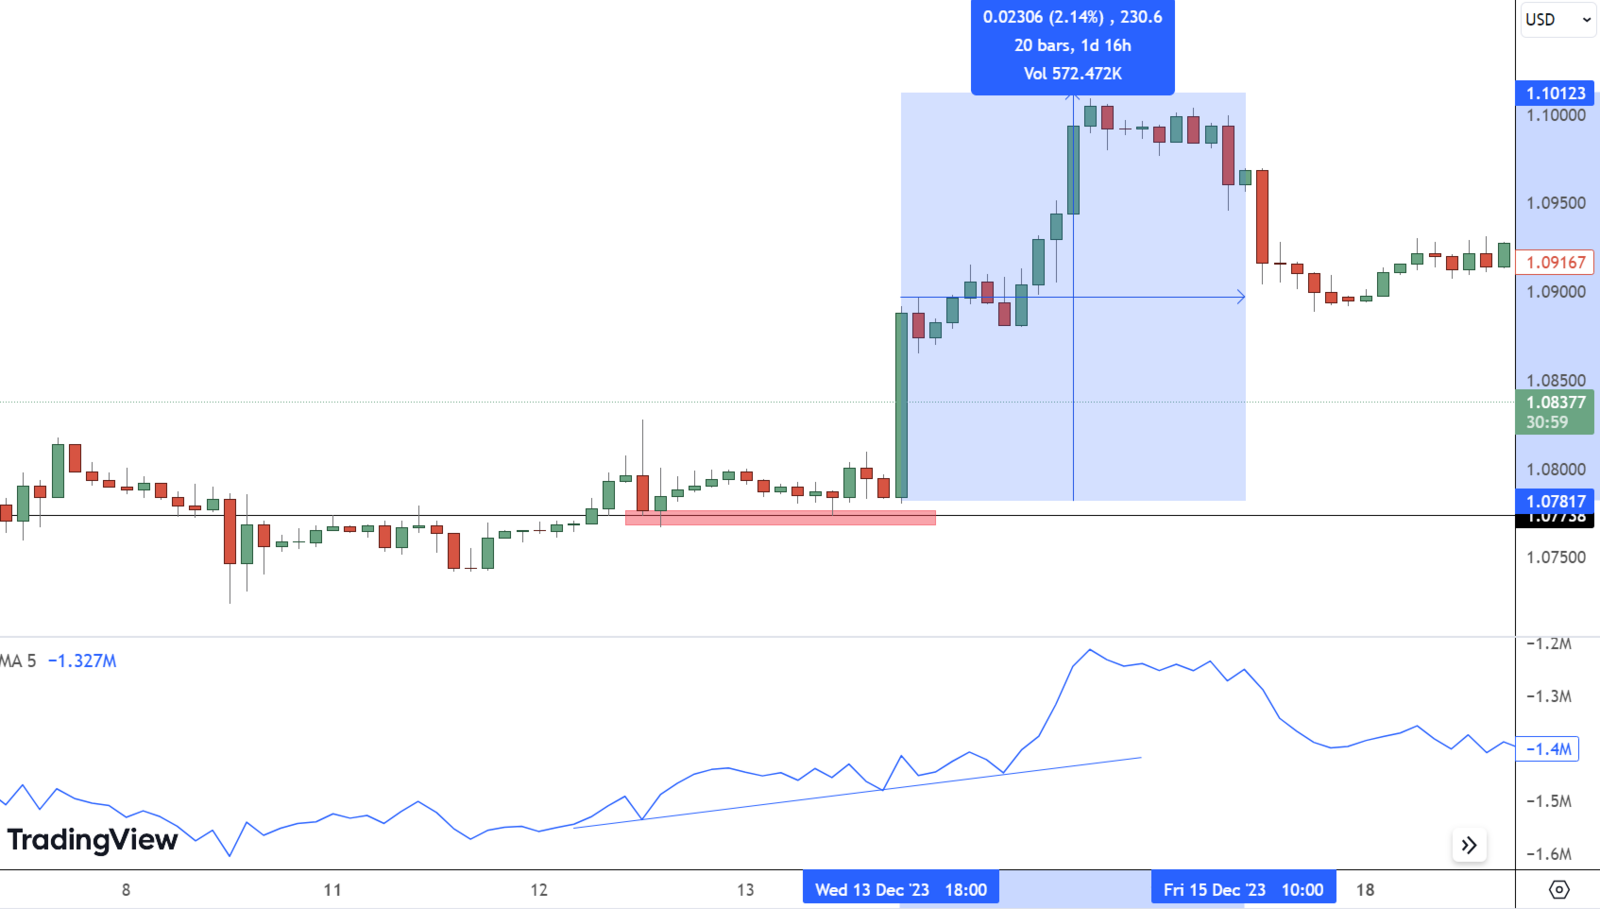
On-Balance Volume accumulates volume depending on whether price closes higher or lower. The concept can help compare participation with price, but spot forex is decentralised and has no single consolidated global exchange volume feed. Retail FX platforms generally use broker or data-provider tick volume. That makes OBV a supporting clue rather than a complete measure of global buying and selling pressure.
RSI: Momentum, Overbought and Oversold
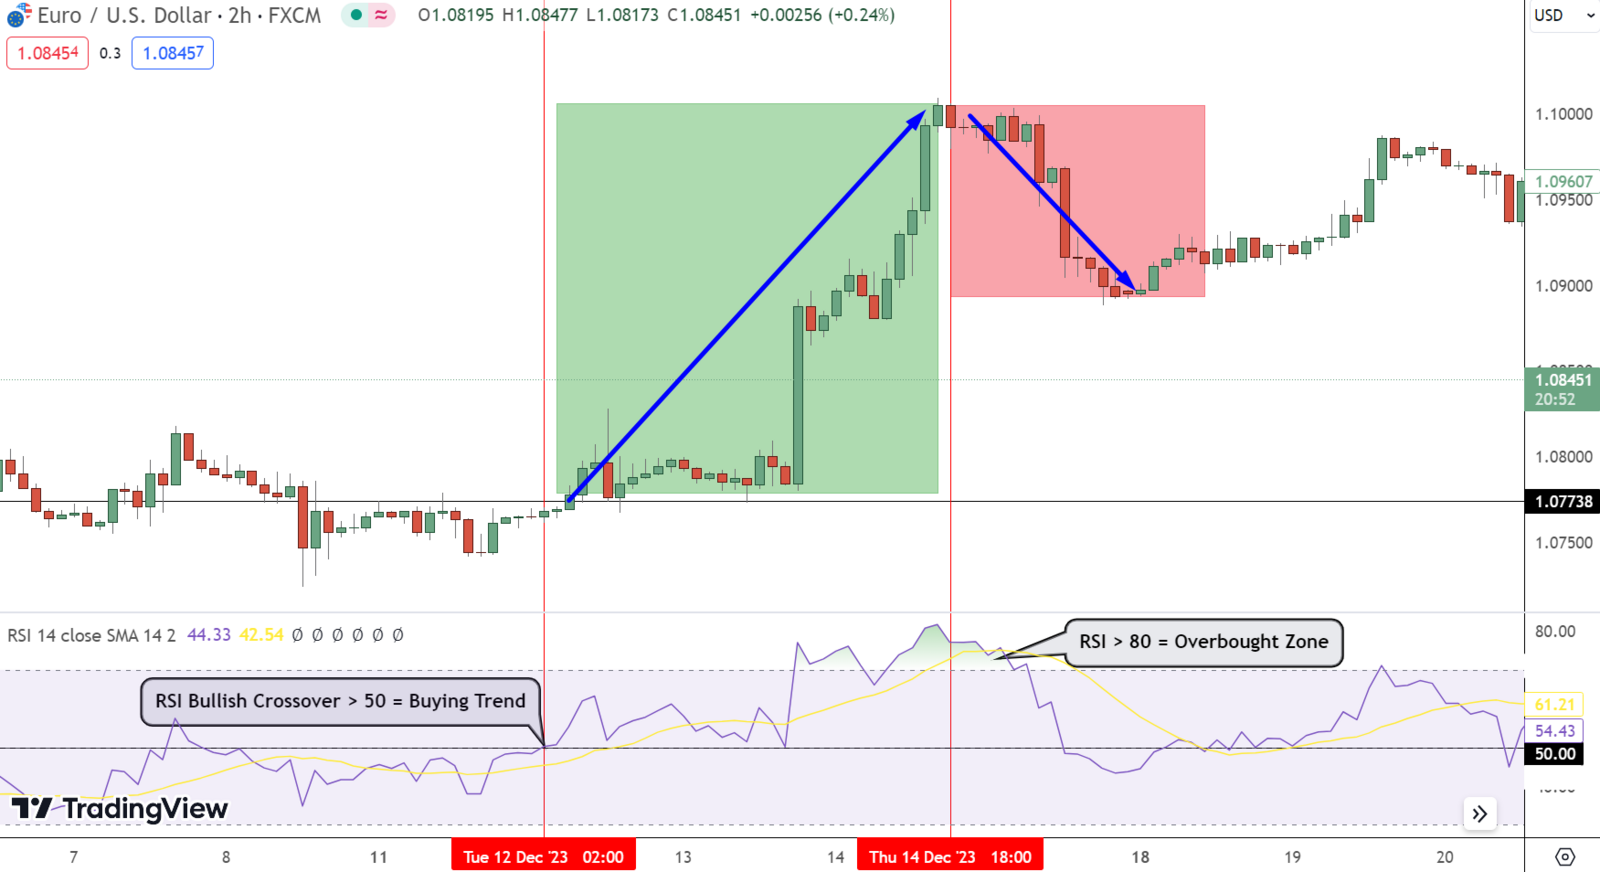
RSI oscillates between 0 and 100. The traditional 70 and 30 levels are commonly used as overbought and oversold reference zones, but overbought does not mean ‘must fall’ and oversold does not mean ‘must rise.’
During strong trends, RSI can remain elevated or depressed for a long time. More useful signals often come from divergence, failure swings or an RSI shift that occurs at an important technical level.
MACD: Trend and Momentum Confirmation
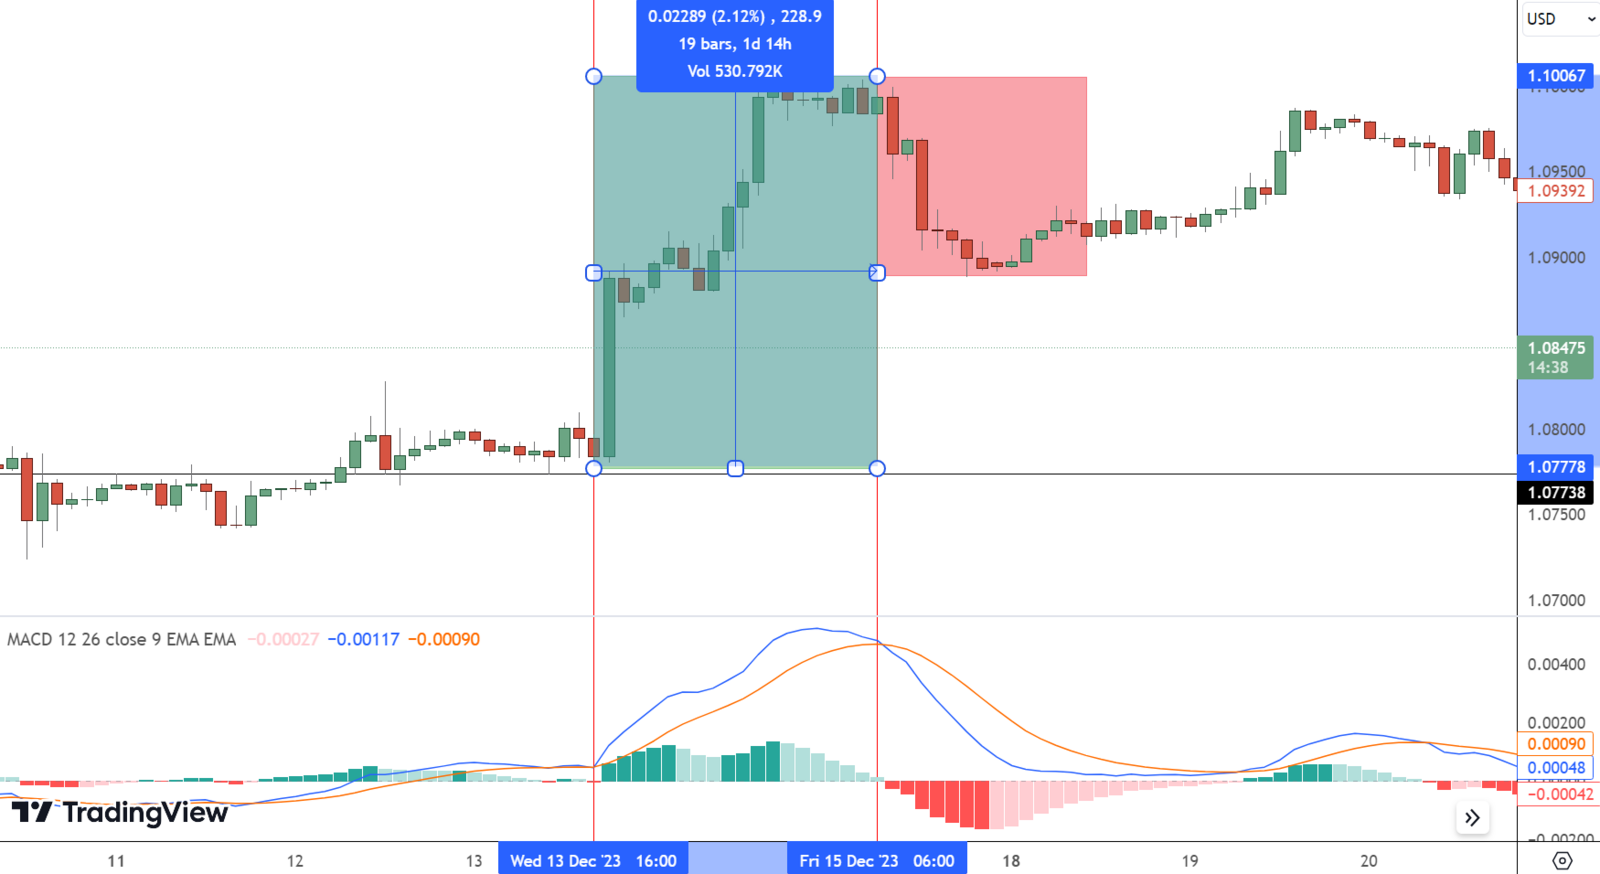
MACD compares two exponential moving averages and typically includes a signal line and histogram. The standard 12-26-9 settings are defaults, not an ‘optimal’ configuration. A bullish crossover can support a long thesis when price structure is also improving, but repeated crossovers inside a sideways market can produce false signals.
Moving Averages: Trend Filters, Not Crystal Balls
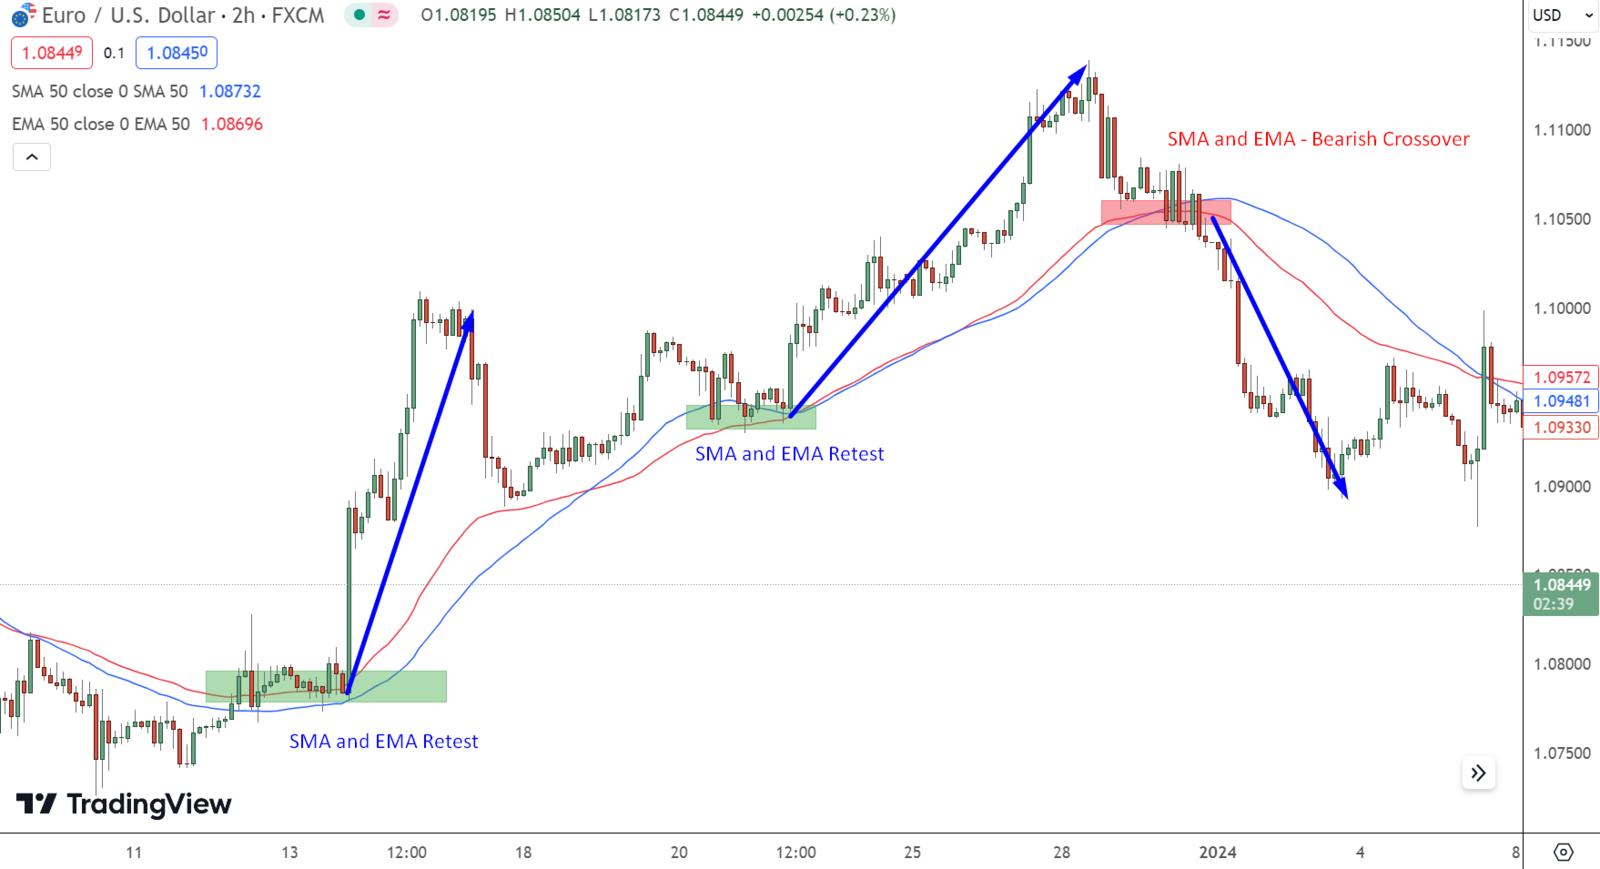
A simple moving average weights each observation equally, while an exponential moving average gives more weight to recent prices. Moving averages are lagging tools because they are calculated from past price data.
Their value is often highest as a trend filter or confluence zone. A pullback into a rising 50-period average that also matches prior support can be more meaningful than a moving-average touch on its own.
How to Use Multiple Timeframes in Forex Technical Analysis
Multi-timeframe analysis is one of the simplest ways to stop a good setup from being taken in the wrong context. A trader can use one timeframe for direction, a second for setup quality and a third for execution.
| Role | Example timeframe | What to analyse |
|---|---|---|
| Higher-timeframe bias | Daily / 4-hour | Trend, major support/resistance, macro structure |
| Setup timeframe | 4-hour / 1-hour | Pullback, breakout, consolidation, indicator confirmation |
| Execution timeframe | 15-minute / 5-minute | Trigger, stop placement and precise invalidation |
Multi-Timeframe Example
Suppose EUR/USD is in a clear daily uptrend, the four-hour chart pulls back into former resistance that may now act as support, and the one-hour RSI recovers from a neutral zone while price forms a bullish rejection candle. The lower-timeframe signal is stronger because it agrees with the higher-timeframe structure. If the daily chart were in a strong downtrend, the exact same one-hour signal would deserve more caution.
Best Forex Analysis Tools: What Each Tool Is Actually For
| Tool | Best question it answers | Common mistake |
|---|---|---|
| Economic calendar | What high-impact event is coming? | Trading the headline without knowing consensus |
| Bond yields / rate expectations | Is monetary-policy pricing changing? | Watching one country’s rate in isolation |
| Support & resistance | Where has price repeatedly reacted? | Treating every line as exact rather than as a zone |
| ADX | Is trend strength increasing or weak? | Using ADX to decide direction |
| RSI | Is momentum stretched or shifting? | Automatically selling above 70 / buying below 30 |
| MACD | Is momentum/trend relationship changing? | Chasing every crossover in a range |
| Moving averages | What is the prevailing trend/filter? | Assuming the average causes price to reverse |
| COT / positioning | Is a futures trade becoming crowded? | Treating weekly positioning as a short-term entry signal |
3. Forex Sentiment Analysis
Sentiment analysis studies how traders are positioned and how confident they are in a market view. It can explain why a fundamentally strong currency stops rising: the trade may already be crowded, leaving fewer new buyers to push it higher.
One widely used institutional reference is the CFTC Commitments of Traders report. Its Traders in Financial Futures data include currency futures and divide reportable positions into categories. COT is useful for understanding medium-term positioning, but it covers futures and options rather than the entire OTC spot FX market and is not a real-time signal.
Retail-sentiment indicators can also help, especially as a contrarian input, but they represent clients of a specific broker or data provider. A 70% long retail reading does not mean 70% of the entire forex market is long.
What If Fundamental, Technical and Sentiment Signals Disagree?
Fundamentals bullish, technicals bearish
The macro thesis may be early, already priced in or temporarily overwhelmed. Wait for price structure to improve rather than forcing the trade.
Technicals bullish, fundamentals weak
A short-term technical rally can still occur inside a weak macro backdrop. Reduce the expected holding period and know the next catalyst.
Fundamentals and technicals bullish, sentiment extremely crowded
The trade can still work, but the risk of a sharp unwind is higher. Avoid chasing stretched entries and monitor positioning.
No clear agreement anywhere
Doing nothing is a valid decision. Analysis should filter trades as well as generate them.
How to Analyse a Forex Pair Step by Step
- Choose the pair and identify which two economies and central banks matter.
- Check the economic calendar for high-impact events over your expected holding period.
- Compare monetary-policy expectations, inflation, employment and growth trends.
- Write a simple fundamental bias: bullish, bearish or neutral — and why.
- Move to the higher timeframe and mark trend, major support/resistance and obvious range boundaries.
- Use the setup timeframe to look for a pullback, breakout or reversal structure that fits the bias.
- Add only the indicators that answer a specific question — for example ADX for trend strength or RSI for momentum.
- Check sentiment or COT positioning to see whether the trade is already unusually crowded.
- Define the exact invalidation level and position size before entry.
- After the trade, review both the result and the process. A losing trade can still come from good analysis, while a winning trade can still come from poor discipline.
Worked Example: Combining All Three Methods on EUR/USD
Assume the Federal Reserve has become more dovish while euro-area data are stabilising. That creates a tentative fundamental argument for EUR/USD strength. On the daily chart, EUR/USD is above a rising moving average and has broken a major resistance zone. The four-hour chart then pulls back toward that former resistance.
On the setup timeframe, RSI holds above its prior swing low and MACD momentum begins to improve. COT data do not show an extreme euro-long position. Instead of buying immediately because ‘everything is bullish,’ the trader waits for price to reclaim the pullback high. The stop is placed beyond the level that invalidates the setup, and the position is sized from the potential loss rather than from the maximum leverage available.
If the next U.S. CPI release is only a few hours away, the trader may decide the event risk is too large and wait. That is the key difference between analysis and prediction: the process does not have to produce a trade every time.
How to Read an Economic Calendar Like a Forex Analyst
An economic calendar becomes far more useful when you stop treating every red-flag event as equally important. The first step is to identify which releases can change the central-bank narrative for the pair you trade. For EUR/USD, that usually means focusing on major U.S. and euro-area inflation, employment, growth and policy events rather than reacting to every minor indicator.
Before the release, write down the consensus forecast, the previous reading and any important revisions. Then define the scenarios. If U.S. CPI is expected at 2.8%, for example, decide what a materially hotter or cooler result would mean for Federal Reserve expectations before the number appears. This avoids inventing the interpretation after price has already moved.
After the release, compare the headline with the details. Payrolls can beat consensus while wages disappoint; CPI can be hot because of one volatile component; GDP can beat expectations while forward-looking PMIs weaken. Then check whether bond yields and the currency confirm the interpretation. If the dollar initially rallies on strong data but Treasury yields fall, the first FX move may be less reliable than it looks.
Intermarket Analysis: What Other Markets Can Tell Forex Traders
Currencies do not trade in isolation. Bond yields, equity indices and commodities can help explain why a forex move is happening. The relationship is not fixed, but these markets can provide useful confirmation when the macro story is clear.
For example, if markets become more hawkish on the Federal Reserve, U.S. yields may rise while EUR/USD falls. If oil prices surge because of a supply shock, currencies of major energy exporters may respond differently from currencies of large energy importers. Gold can also react to the dollar and real-yield expectations, which is why gold and USD moves are often analysed together around U.S. macro releases.
Intermarket analysis should be used as context, not as a mechanical rule. Correlations can change quickly when the source of a shock changes. A geopolitical event originating in the United States can produce a different dollar response from a global liquidity shock, even if both events are described broadly as ‘risk-off.’
How Forex Analysis Changes by Trading Style
A day trader, swing trader and position trader can analyse the same EUR/USD pair and reach different decisions because their holding periods are different. The analysis should match the time horizon rather than forcing one process onto every trade.
Day Traders
Short-term traders usually care most about today’s catalysts, session liquidity, intraday support/resistance and the immediate reaction to data. A long-term macro view can provide context, but a day trade should not be held simply because the trader believes the currency will eventually move in that direction.
Swing Traders
Swing traders need both macro context and technical structure. A several-day position can be affected by overnight financing, multiple data releases and changes in risk sentiment. The four-hour and daily charts often become more useful than five-minute noise.
Position Traders
Longer-term traders focus more heavily on relative monetary policy, growth, inflation, fiscal policy and major weekly or monthly technical levels. A short-term indicator crossover is rarely enough to change a multi-week thesis unless it signals a larger structural shift.
Risk Management Is Part of Market Analysis
Analysis is incomplete until the trade has an invalidation level. If your EUR/USD thesis requires price to hold above a former breakout level, then a decisive break below that structure may invalidate the trade even if the macro story has not changed yet. The stop should be placed because the setup is wrong beyond that level, not because an arbitrary number of pips feels comfortable.
Position size then converts the analytical idea into account risk. Two traders can use the same entry and stop but take very different risks because their position sizes differ. This is why leverage should come after the analysis, not before it. The maximum leverage offered by a broker is not a recommendation for how much exposure to use.
Finally, review the trade in two layers. First ask whether the market thesis was correct. Then ask whether the execution was good: entry quality, stop placement, position size, spread, slippage and discipline. Separating analysis quality from trade outcome is one of the fastest ways to improve a repeatable process.
Common Forex Market Analysis Mistakes
Using five versions of the same signal
RSI, stochastic, MACD and several moving averages can all be derived from the same price data. More indicators can create false confidence rather than independent confirmation.
Ignoring the second currency
EUR/USD is not just a dollar trade. A dollar view must be compared with what is happening to the euro.
Treating a news release as simply good or bad
The market reacts to the surprise versus expectations and to how the result changes the policy path.
Using technical levels without event awareness
A perfect support zone can fail instantly if a central bank surprises the market.
Using sentiment as a precise timing tool
Crowded positioning can stay crowded for weeks. Sentiment is context, not a stopwatch.
Forgetting transaction costs and volatility
A strategy that looks attractive before spread, slippage and financing can be weak after costs.
Not defining invalidation
A market opinion becomes a trade plan only when you know what would prove it wrong.
Frequently Asked Questions
What is forex market analysis?
Forex market analysis is the process of studying economic drivers, price action and trader positioning to form a structured view of a currency pair and define a trading plan.
What are the three types of forex analysis?
The three most common are fundamental analysis, technical analysis and sentiment analysis. Fundamental analysis studies macro drivers, technical analysis studies price behaviour, and sentiment analysis studies positioning and crowd behaviour.
What is technical analysis in forex?
Forex technical analysis studies trends, support and resistance, momentum and indicators such as ADX, RSI, MACD and moving averages to identify market structure, entries, exits and invalidation levels.
Which technical analysis is best for forex?
There is no single best indicator. Price structure should come first. Trend tools, momentum indicators and volatility measures answer different questions and work best when they are not duplicating one another.
Is fundamental or technical analysis better for forex?
Neither is universally better. Fundamental analysis is stronger for understanding the macro catalyst and medium-term bias, while technical analysis is stronger for timing and risk definition.
What is multi-timeframe analysis in forex?
It means analysing the same currency pair across more than one timeframe — commonly a higher timeframe for trend, a middle timeframe for setup and a lower timeframe for execution.
How do forex traders measure sentiment?
Common tools include CFTC Commitments of Traders data, options positioning and broker retail-sentiment indicators. Each measures only part of the market, so the limitation of the data source matters.
Can forex analysis predict the market?
No. Analysis helps structure probabilities and risk; it cannot eliminate uncertainty. Unexpected news, liquidity changes and positioning can invalidate even a well-researched view.
How many indicators should a forex trader use?
There is no correct number, but each indicator should answer a different question. A simple setup using market structure plus one trend tool and one momentum tool is often easier to interpret than a crowded chart.
What should beginners analyse first in forex?
Start with the trend and major support/resistance, then check the economic calendar and the central-bank backdrop. Add indicators only after you understand what question each one is meant to answer.
Bottom Line
Forex market analysis works best when technical, fundamental and sentiment analysis are treated as complementary rather than competing methods. Fundamentals explain the macro pressure, technical analysis shows how that pressure is appearing in price, and sentiment shows how crowded the trade may already be.
For beginners, the strongest improvement is usually not adding another indicator. It is building a repeatable sequence: understand the catalyst, read the higher-timeframe structure, identify the setup, check positioning, define the invalidation level and size the risk before entering.
AAFX.io provides educational forex guides, technical analysis and market commentary designed to help readers connect macro drivers with price action without treating any indicator, chart pattern or forecast as guaranteed.
Editorial Sources
Key facts and methodology were checked against the 2025 BIS Triennial Survey, BLS Employment Situation methodology, Federal Reserve longer-run goals and strategy, and the CFTC Commitments of Traders documentation.
Sources & Methodology
Primary-source standard: Market-moving facts should link to original data releases, regulator notices, company filings or official project announcements whenever available. Secondary reporting is used for additional context, not as a substitute for original evidence.
Page last reviewed: