
Natural gas prices remain under significant selling pressure, with the supplied five-hour chart showing a price of $2.765 and a Relative Strength Index (RSI) reading of 19.69. The market is approaching a critical technical support level, raising the risk of a further decline toward $2.616. However, deeply oversold conditions also increase the possibility of a temporary rebound. Traders must weigh bearish momentum against the risk of a sharp reversal as weather forecasts, storage levels and demand expectations influence the broader market.
Natural Gas Tests Critical Support
The five-hour technical setup points to a firmly bearish trend. Natural gas is trading near the 78.6% Fibonacci retracement, a level traders monitor when assessing whether a previous price decline could extend further.
The RSI at 19.69 sits well below the conventional 30 threshold used to identify oversold conditions. Although this reading suggests selling may be stretched, it does not guarantee an immediate recovery. Prices can remain oversold during sustained downtrends.
The latest bearish Marubozu candle, characterized by a prominent body and little or no wick, reinforces the evidence of strong selling pressure. A decisive break below $2.765 could expose the next downside target at $2.616, identified in the supplied analysis as a major low.
Broader fundamentals also matter. On October 6, the U.S. Energy Information Administration projected that domestic natural gas inventories would reach 3,850 billion cubic feet by the end of October, approximately 2% above the five-year average. Ample storage could help meet winter heating demand, although colder weather and stronger liquefied natural gas exports could tighten market conditions. Source: EIA.
Bearish and Bullish Price Scenarios
The primary technical scenario favors selling pressure, but entering after an additional decline carries risks when momentum is already stretched. Traders may look for confirmation around resistance rather than automatically opening short positions near support.
Key levels to monitor include:
- $2.765: Immediate support in the supplied five-hour chart.
- $2.616: Potential downside target if support breaks decisively.
- $2.890–$2.933: Resistance zone where a rebound could encounter renewed selling.
- $0.059 ATR: Reported average true range, indicating the scale of recent price movement on the chart’s stated timeframe.
A sustained move below $2.765 would strengthen the bearish case, particularly if selling volume increases. Conversely, a recovery above $2.890 followed by a confirmed break through $2.933 would weaken the immediate downside setup.
The bullish alternative depends on evidence that buyers are returning. A strong green candle accompanied by rising volume could signal short covering or fresh demand. Without that confirmation, a rebound remains vulnerable to renewed selling.
Trading Risks and Market Outlook
Natural gas is sensitive to weather forecasts, production, storage data and export demand. These factors can quickly change expectations for supply and consumption, creating sharp price swings even when the technical trend appears clear.
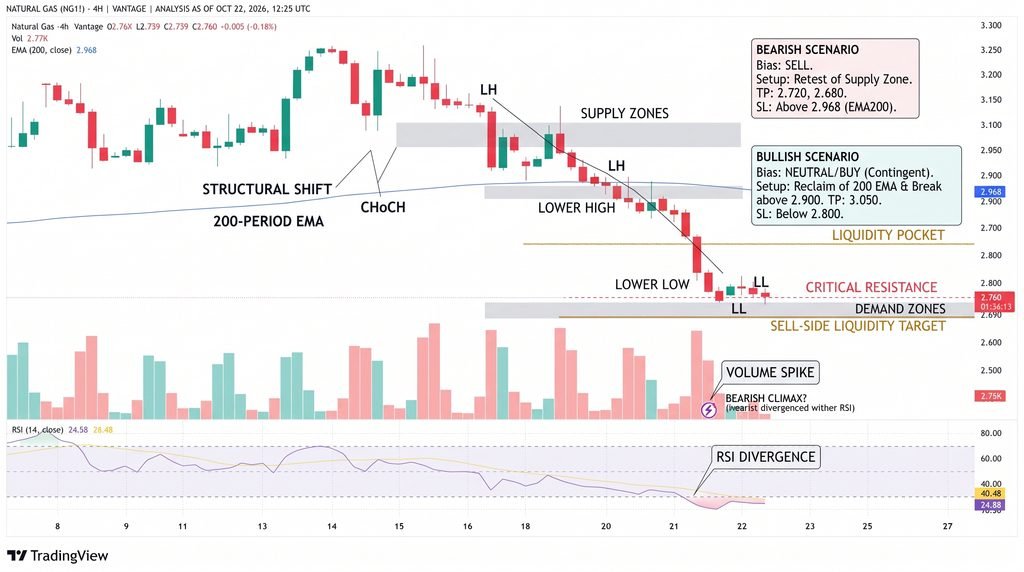
Natural Gas Price Chart – Source: Tradingview
The $2.767–$2.890 area should therefore be treated cautiously under the supplied analysis. Trading within this range without confirmation may expose participants to false breakouts and abrupt reversals.
The reported ATR of $0.059 also highlights the importance of position sizing and risk controls. Stop-loss distances should reflect market volatility, while traders should avoid assuming that an oversold RSI automatically signals a bottom.
Conclusion
Natural gas retains a bearish technical bias near $2.765, with $2.616 emerging as the next downside reference if support fails. Nevertheless, an RSI of 19.69 leaves room for a relief rally. A confirmed break below support would favor further losses, while a recovery through $2.890–$2.933 could indicate improving short-term momentum. Traders should wait for price and volume confirmation before committing to either direction.
Sources & Methodology
Primary-source standard: Market-moving facts should link to original data releases, regulator notices, company filings or official project announcements whenever available. Secondary reporting is used for additional context, not as a substitute for original evidence.
Page last reviewed: