
The New Zealand dollar recovered above 0.5600 against the US dollar on Tuesday after briefly touching 0.5580, its weakest level since April 2025. The rebound followed a softer US dollar, as falling crude oil prices and retreating Treasury yields eased some support for the greenback. However, a hawkish Federal Reserve outlook and ongoing Middle East tensions continue to favor defensive dollar demand. Technically, NZD/USD remains vulnerable while trading below key moving-average resistance, leaving 0.5580 as the critical level for determining whether the decline resumes.
Dollar Weakness Offers Limited Relief
The latest recovery in NZD/USD reflects a temporary easing in demand for the US dollar rather than a confirmed improvement in the New Zealand currency’s outlook. Lower oil prices can reduce concerns about inflation, potentially easing upward pressure on US bond yields and encouraging investors to take profits after the dollar’s recent advance.
Even so, the Federal Reserve remains an important driver of currency markets. Expectations that US interest rates may stay elevated for longer can support the dollar by making dollar-denominated assets more attractive. Meanwhile, escalating geopolitical tensions in the Middle East may sustain demand for traditional safe-haven currencies.
These competing forces leave the New Zealand dollar struggling to build lasting momentum. Without a stronger catalyst, the latest bounce could remain a corrective move within a broader bearish trend.
NZD/USD Faces Resistance Near 0.5641
Price action since the beginning of October suggests consolidation following the decline from the August swing high. However, consolidation does not necessarily signal a reversal. On the four-hour chart, NZD/USD remains below its 100-period simple moving average (SMA), indicating that sellers retain an advantage.
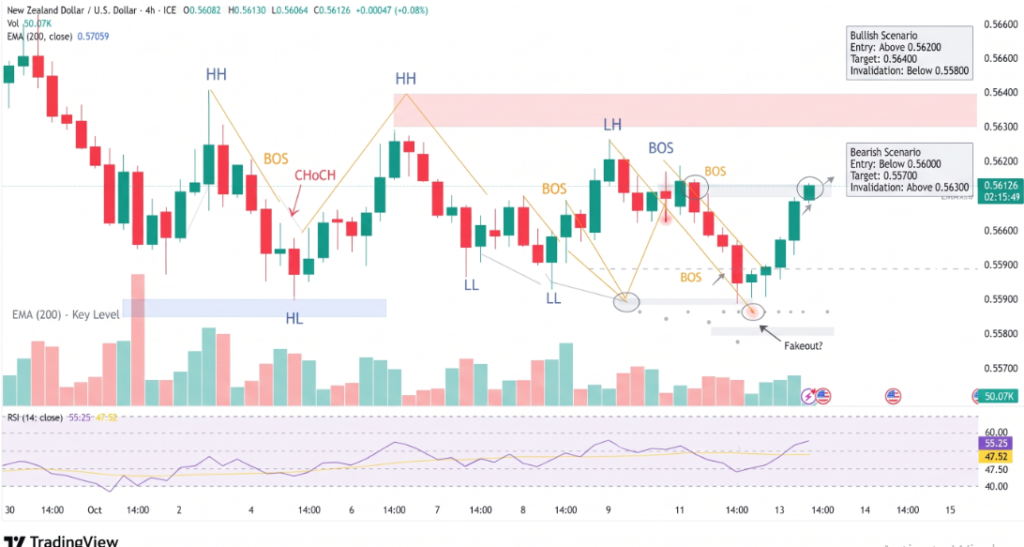
Momentum indicators also offer limited evidence of a sustained recovery. The Moving Average Convergence Divergence (MACD) remains slightly negative, while the Relative Strength Index (RSI) is hovering near 50. The RSI measures the strength of recent price movements; a reading around 50 generally signals a lack of clear directional momentum.
Traders should monitor these levels closely:
- Immediate resistance: 0.5630, near the upper boundary of the recent trading range.
- Key recovery barrier: 0.5641, where the 100-period SMA sits.
- Critical support: 0.5580, the recent low.
- Bearish extension: A decisive break below 0.5580 could expose NZD/USD to further losses.
A sustained move above 0.5641 would weaken the immediate bearish outlook and improve the prospects for a broader recovery. Until then, rallies may encounter selling pressure.
Conclusion:
NZD/USD’s rebound above 0.5600 has yet to overturn its bearish technical structure. A break below 0.5580 would reinforce downside risks, while resistance at 0.5630 and 0.5641 may limit further gains. A convincing recovery requires the pair to reclaim its moving average and sustain buying momentum. Until that happens, the New Zealand dollar remains exposed to renewed weakness, particularly if US rate expectations and geopolitical uncertainty continue to support the greenback.
Sources & Methodology
Primary-source standard: Market-moving facts should link to original data releases, regulator notices, company filings or official project announcements whenever available. Secondary reporting is used for additional context, not as a substitute for original evidence.
Page last reviewed: