
Pepe (PEPE) is attempting to recover after falling approximately 5% in the previous session, with its price consolidating inside a symmetrical triangle. Rising futures activity and improving technical indicators suggest a possible bullish setup, although large-wallet behavior remains mixed. PEPE traded near $0.00000450 in the supplied Friday snapshot, leaving traders focused on resistance at $0.00000476. A confirmed breakout could open the way toward $0.00000536, but failure to clear resistance may expose the token to further losses.
On-chain data shows that wallets holding more than 1 billion PEPE accounted for approximately 96.38% of circulating supply, down slightly from 96.4% on September 1. Meanwhile, wallets holding between 100 million and 1 billion tokens increased their share from 2.55% to 2.56%.
These movements indicate only modest changes in ownership distribution and do not establish a decisive shift in whale sentiment. According to the supplied figures, PEPE’s exchange-held supply declined to 17.8% from 18.75%. Lower exchange balances can reduce immediately available selling liquidity, but they do not guarantee that holders will continue accumulating.
The proportion of PEPE supply in profit rose to 45.67%. That may indicate improving market conditions, although profitable holders could also sell to secure gains if momentum weakens.
Futures Activity Supports Recovery
Data from CoinGlass shows that PEPE futures open interest increased by 2% over 24 hours. Open interest measures outstanding futures contracts and can reveal changes in market participation. However, rising open interest alone cannot determine whether new positions are bullish or bearish.
The funding rate improved from -0.0133% to -0.0078%, indicating that negative funding became less pronounced. Funding rates help balance perpetual futures prices against the underlying market, but they can change rapidly as positioning shifts.
Technical indicators also show improving momentum. The daily Moving Average Convergence Divergence (MACD) moved above its signal line in positive territory. Meanwhile, the Relative Strength Index (RSI) near 60 indicates stronger buying momentum without reaching the commonly used overbought threshold of 70.
PEPE Forecast: Key Levels to Watch
PEPE’s chart shows a symmetrical triangle bounded by descending resistance near $0.00000476 and rising support around $0.00000396. This pattern reflects a narrowing trading range, but the next directional move requires confirmation from price action.
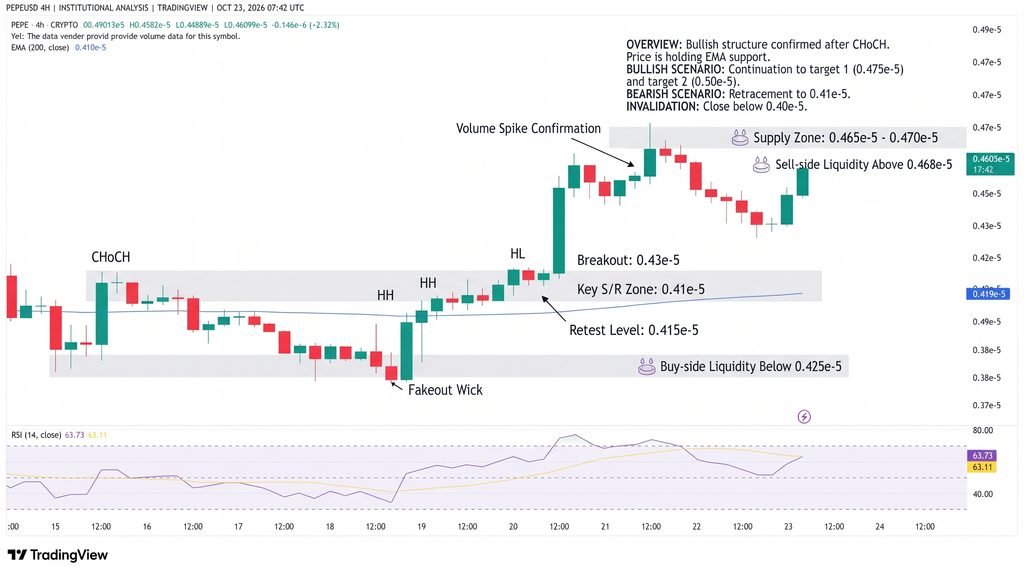
A sustained breakout above $0.00000476 could bring the September 22 high at $0.00000536 into focus. Further potential targets from the supplied Fibonacci extension analysis sit at $0.00000617 and $0.00000737. These are possible resistance areas, not guaranteed price targets.
Key levels for traders include:
- Immediate resistance: $0.00000476.
- Next upside target: $0.00000536.
- Fibonacci extensions: $0.00000617 and $0.00000737.
- Initial support: $0.00000414, near the 50% retracement level.
- Lower support: $0.00000364, the October 8 low.
A decisive move above resistance would strengthen the bullish outlook. Conversely, rejection near $0.00000476 could send PEPE back toward $0.00000414. A break below that support would expose $0.00000364 and weaken the recovery scenario.
Conclusion
PEPE’s rising futures open interest and improving momentum support the possibility of a triangle breakout, but mixed whale activity leaves the outlook uncertain. Traders should monitor $0.00000476 for confirmation, $0.00000536 as the next potential target, and $0.00000414 as initial support. Until resistance is broken decisively, the recovery remains a developing setup rather than a confirmed rally.
Sources & Methodology
Primary-source standard: Market-moving facts should link to original data releases, regulator notices, company filings or official project announcements whenever available. Secondary reporting is used for additional context, not as a substitute for original evidence.
Page last reviewed: