
Pi Network (PI) remains under pressure, trading around $0.0755 on Wednesday after testing the $0.0700 level earlier in the session. The token faces renewed downside risk as futures open interest declines and technical indicators continue to favor sellers. A key support area near $0.0740 is holding for now, but a decisive break could expose the $0.0704 low identified in the latest market analysis. With PI trading below both its 50-day and 200-day moving averages, a sustained recovery remains difficult to establish.
PI futures activity weakens as prices fall
Data cited from Blockworks shows that PI futures open interest fell to $7.56 million on Wednesday, down from $8.16 million a day earlier. That represents a decline of approximately 7.4% in the value of outstanding futures positions.
Open interest measures the total value or number of derivatives contracts that remain open. When it falls alongside a declining token price, it can indicate that traders are closing positions and reducing exposure rather than adding fresh risk. The latest figures therefore point to weaker participation in PI’s derivatives market.
However, falling open interest does not automatically mean that traders are becoming more bearish. It can reflect the unwinding of both long and short positions, so price direction and other derivatives indicators remain important when assessing sentiment.
The broader price data also illustrates the pressure on PI. Historical market records show the token trading around $0.075 on November 4, with an intraday low near $0.0714 on one tracked exchange. Prices can vary between platforms, so individual exchange lows should not be confused with a universally established market low.
$0.0740 support faces a critical test
PI remains below its 50-day Exponential Moving Average (EMA) at $0.0822 and its 200-day EMA at $0.1134. These moving averages track average prices over different periods, giving traders a view of short- and longer-term trends. Trading below both indicates that the broader price structure remains weak.
A descending resistance trendline near $0.0779 adds another obstacle to any recovery. The Relative Strength Index (RSI), at 36, remains below its neutral midpoint of 50, suggesting sellers retain the advantage. Meanwhile, the MACD is above its signal line but remains negative. This points to some improvement in momentum without confirming a bullish reversal.
The immediate support level is $0.0740, corresponding to the October 15 low. A sustained move below it would put $0.0704 into focus, the low used as the reference point in the supplied technical analysis.
PI outlook: Resistance limits recovery prospects
For buyers, the first challenge is to reclaim $0.0779 and then clear the 50-day EMA at $0.0822. A stronger recovery would face another significant barrier at $0.1049, the 50% Fibonacci retracement of the decline from $0.1394 to $0.0704.
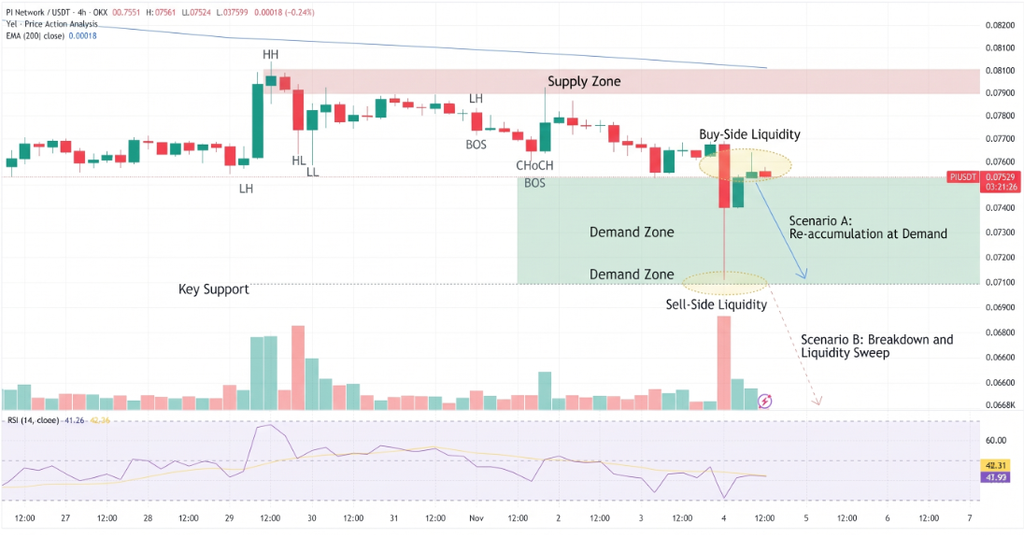
Key levels to monitor:
- Support: $0.0740, followed by $0.0704.
- Resistance: $0.0779 and $0.0822.
- Major recovery hurdle: $0.1049.
Conclusion
Pi Network’s weakening derivatives activity and position below both major moving averages keep the outlook tilted to the downside. Holding $0.0740 could allow consolidation, but a confirmed break would expose the $0.0704 reference low. Buyers need to reclaim $0.0779 and $0.0822 before a broader recovery becomes more credible.
Sources & Methodology
Primary-source standard: Market-moving facts should link to original data releases, regulator notices, company filings or official project announcements whenever available. Secondary reporting is used for additional context, not as a substitute for original evidence.
Page last reviewed: