
Natural gas is trading near $2.907 as prices consolidate above Ichimoku cloud support, with limited momentum leaving the market vulnerable to a sharp move in either direction. The 50-day simple moving average (SMA) at $2.885 is providing short-term support, but the 200-day SMA near $2.995 and the SuperTrend indicator around $2.9895 are capping gains. With the Average Directional Index (ADX) at just 9.28, the current market offers little evidence of a sustained trend. A break beyond the $2.848–$2.995 boundaries could determine the next directional move.
Natural gas holds above cloud support
The technical picture is mixed. Natural gas remains above the Ichimoku cloud, which spans approximately $2.848 to $2.896. The cloud can help traders identify potential support and resistance, and the current position suggests that buyers are defending a short-term stabilization zone.
The 50-day SMA at $2.885 also sits below the current price, reinforcing the nearby support area. Meanwhile, the daily MACD reading of -0.0069 has moved above its signal line at -0.0082. This bullish crossover indicates that downside momentum has eased, although both readings remain below zero.
The longer-term indicators are less encouraging. Natural gas is still below its 200-day SMA at $2.995, while the SuperTrend indicator signals resistance near $2.9895. These levels create an overhead barrier that buyers must overcome before a broader recovery becomes more convincing.
Low ADX signals a market without direction
The ADX reading of 9.28 points to exceptionally weak trend strength. ADX measures the strength of a trend, not whether prices are rising or falling. Readings below 20 are commonly associated with weak or range-bound conditions, making directional signals less reliable.
Trading activity is also fading. The reported decline in volume, combined with a doji candle near $2.907 on November 4, suggests that buyers and sellers are struggling to establish control. A doji forms when opening and closing prices are close together, often reflecting indecision.
The current consolidation range is approximately $2.850–$2.980, with three reported tests of both the support and resistance boundaries. The Fibonacci retracement level at $2.890 aligns with the 50-day SMA, adding another reference point for traders watching the lower half of the range.
$2.995 and $2.848 define breakout levels
The market remains vulnerable to false moves while it trades between the established boundaries. Traders may look for stronger volume and a rising ADX before treating a breakout as sustainable.
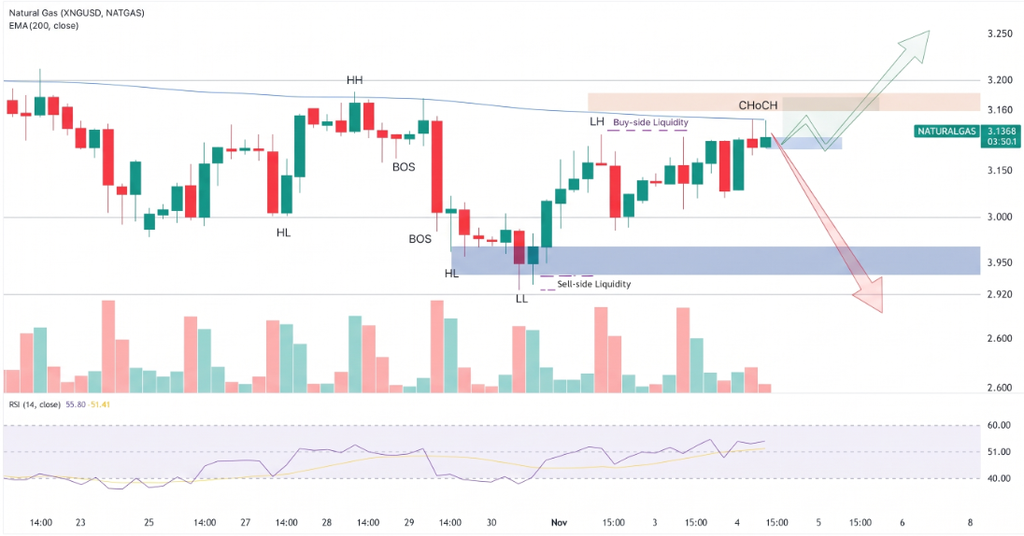
Key levels to monitor:
- Resistance: $2.975–$2.995, including the 200-day SMA.
- Support: $2.890, followed by $2.850 and $2.848.
- Bullish threshold: A sustained move above $2.995.
- Bearish threshold: A decisive break below $2.848.
The Average True Range (ATR) is 0.0618, equivalent to roughly 2.1% of the current price, indicating that daily fluctuations can still be significant despite the weak trend.
Conclusion
Natural gas remains in consolidation, with cloud support and the 50-day average helping stabilize prices while longer-term resistance limits gains. A sustained break above $2.995 would improve the bullish outlook, whereas a move below $2.848 would weaken the current base and expose the market to renewed downside. Until either level breaks with stronger volume and improving ADX, a neutral approach remains more defensible than trading the middle of the range.
Sources & Methodology
Primary-source standard: Market-moving facts should link to original data releases, regulator notices, company filings or official project announcements whenever available. Secondary reporting is used for additional context, not as a substitute for original evidence.
Page last reviewed: