
Pi Network (PI) remains under selling pressure after extending its decline for a seventh consecutive day, with the token trading near $0.0830 and approaching the critical $0.0800 threshold. The weakness comes as social activity around PI increases, suggesting that investor concern is intensifying even as market participation grows. Data from Santiment showed PI’s social dominance rising to 0.16% on Tuesday from 0.03% a day earlier. Meanwhile, deteriorating technical momentum and resistance from key moving averages continue to favor sellers.
PI Social Activity Signals Concern
The sharp increase in social dominance provides an important sentiment signal. PI-related discussions accounted for 0.16% of crypto-related social activity on Tuesday, compared with just 0.03% the previous day.
The increase does not automatically mean that investors are becoming more bearish. However, a sudden rise in social attention while an asset is falling can indicate that traders are reacting to losses, uncertainty or the possibility of further declines.
PI’s price action remains weak despite the increase in market attention. The token has failed to reclaim several important technical levels, leaving buyers with limited evidence that the recent downtrend is losing momentum.
The key sentiment and price levels are:
- 0.16%: PI social dominance on Tuesday.
- 0.03%: Previous day’s social dominance.
- $0.0830: Approximate PI price at the latest reading.
- $0.0800: Major psychological support level.
Pi Network Technical Outlook Turns Bearish
PI trades below its 50-day exponential moving average at approximately $0.0906, which previously limited upside attempts. The 100-day EMA near $0.0989 and 200-day EMA around $0.1250 are even farther above the current price, reinforcing the broader bearish structure.
Momentum indicators also favor sellers. The MACD has moved below both the zero line and its signal line, indicating weakening momentum. The Relative Strength Index (RSI) is around 37, placing PI close to oversold territory but not yet at an extreme level.
That distinction is important because an RSI below 30 is commonly viewed as oversold, but readings above that threshold can still decline if selling pressure persists.
$0.080 Support Holds the Key
The immediate technical battleground is between the 23.6% Fibonacci retracement at $0.08271 and the July 31 low around $0.0801. Together, these levels form a support zone that could determine PI’s next major move.
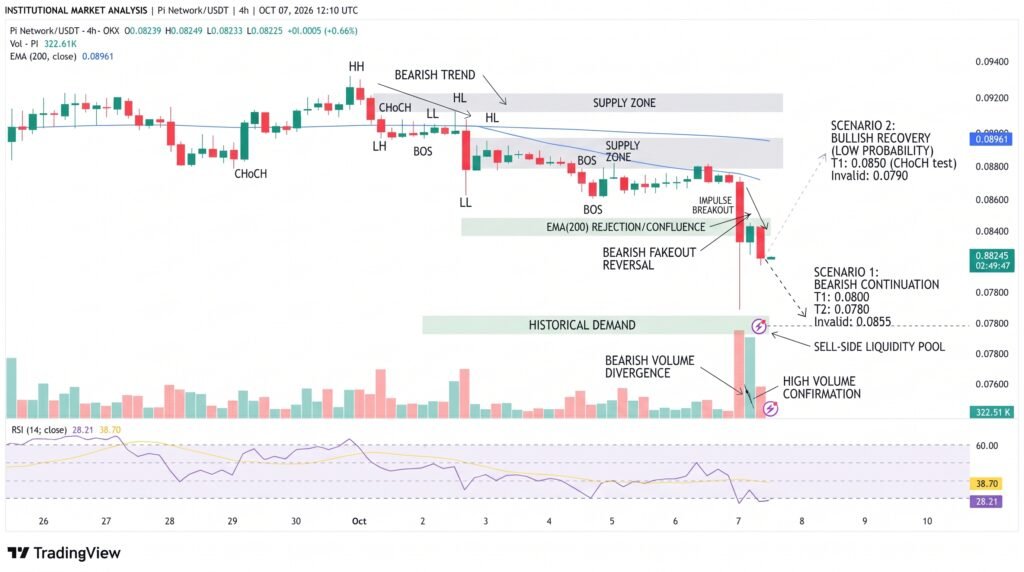
A confirmed break below $0.0800 would weaken the technical structure and expose the July swing low near $0.0704. That level could attract dip buyers if the decline becomes sufficiently extended.
On the upside, PI first needs to recover the $0.0906 50-day EMA. A sustained move above that resistance level would shift attention toward the $0.0989-$0.0990 area, where the 100-day EMA meets the 50% Fibonacci retracement.
Conclusion
Pi Network remains vulnerable to another leg lower as PI trades below its major moving averages and momentum indicators continue to favor sellers. Rising social activity shows that attention is increasing, but it does not yet confirm a bullish reversal. The $0.0800-$0.0827 zone is the critical defense for buyers. A breakdown could expose $0.0704, while a recovery above $0.0906 would provide the first meaningful sign that downside pressure is easing.
Sources & Methodology
Primary-source standard: Market-moving facts should link to original data releases, regulator notices, company filings or official project announcements whenever available. Secondary reporting is used for additional context, not as a substitute for original evidence.
Page last reviewed: