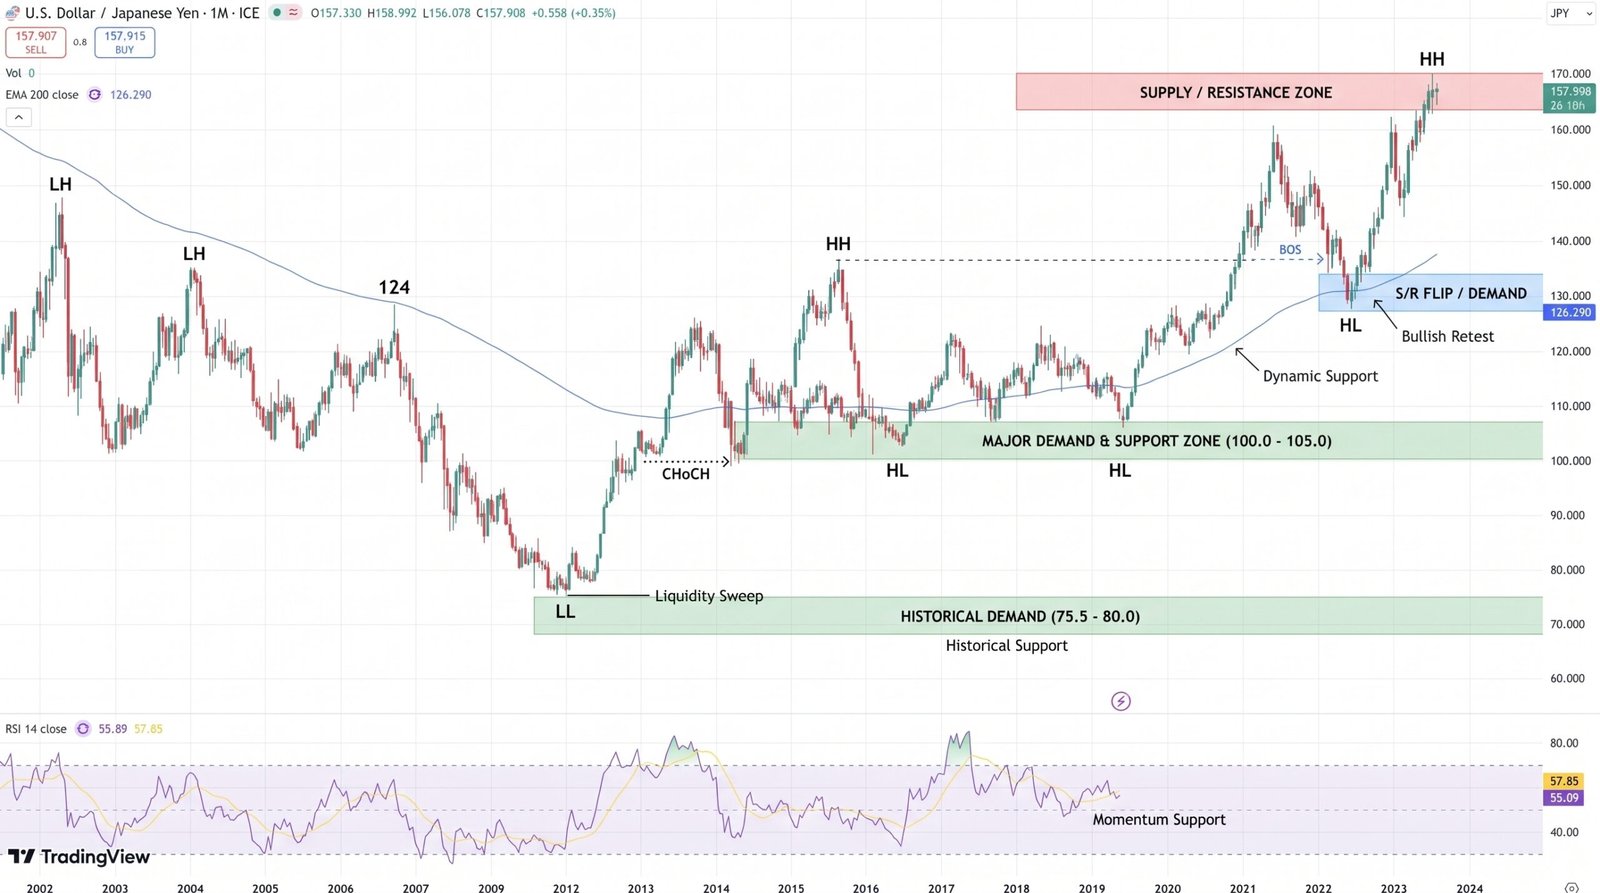
Quick answer: The long-term USD/JPY forecast depends on the expected gap between US and Japanese interest rates, inflation-adjusted returns and international capital flows. A narrowing US yield advantage can support the yen and lower USD/JPY; a persistent or widening advantage can support the dollar. AAFX’s September 2026 research set scenario ranges of 150–160 for end-2026, 145–158 for 2027 and 135–165 around 2030. These are dated editorial scenarios, not live targets or statistical confidence intervals.
Evergreen framework reviewed October 28, 2026. Numerical scenarios originate from September 2026 research. This article does not provide a live exchange rate or a daily trading signal.
USD/JPY measures the number of Japanese yen needed to buy one US dollar. At 150, one dollar buys 150 yen. An increase means the dollar strengthens relative to the yen; a decrease means the yen strengthens. That quotation convention matters when reading a bullish or bearish forecast: bullish USD/JPY means a weaker yen.
This guide explains the assumptions behind the AAFX forex forecasts, how to assess alternative outcomes and what would invalidate the outlook. For a different view of dollar strength, compare our EUR/USD forecast and GBP/USD forecast.
USD/JPY forecast at a glance
| Horizon | Original scenario range | Assumption to test |
|---|---|---|
| End-2026 | 150–160 | A US yield advantage persists, while policy changes and intervention risk limit one-way moves. |
| 2027 | 145–158 | The US–Japan yield gap narrows gradually, allowing moderate yen recovery. |
| Around 2030 | 135–165 | A broad structural range reflects uncertainty over real rates, productivity and capital flows. |
All ranges above were established in September 2026. They are retained to make the original research transparent, rather than silently presenting old numbers as newly calculated forecasts. Prices can move outside every range. The 2027 range describes an annual scenario, not a guaranteed year-end closing price; the 2030 range is a broad long-term reference.
What drives USD/JPY over the long term?
1. Expected Federal Reserve and Bank of Japan policy
Currencies react to changes in expectations. A rate increase does not automatically strengthen a currency if investors had already priced it in, or if the accompanying guidance suggests a slower future path. Compare the expected direction and pace of both central banks, rather than treating one announcement as a complete forecast.
The relevant question is whether new evidence increases or reduces the expected return advantage of dollar assets over yen assets. Inflation, employment, wage growth and economic activity can all change that assessment. A forecast should distinguish an observed policy decision from an analyst’s assumption about future decisions.
2. Bond yields and inflation-adjusted returns
Policy rates are one part of the picture. Treasury and Japanese government bond yields reflect expectations across different maturities. Comparing like-for-like maturities helps avoid mistaking a change in one part of the yield curve for a broad shift in relative returns.
Nominal yield differences also need context. Higher inflation can erode the purchasing power of interest income, while hedging costs can change the return available to a foreign investor. A higher headline yield therefore does not guarantee either superior total returns or currency appreciation.
3. Carry trades and positioning
A yen-funded carry trade borrows or sells yen to obtain exposure to higher-yielding assets. The interest-rate difference is only one source of return: exchange-rate movements can outweigh it. When volatility rises, investors may reduce leverage and buy back yen, making a reversal sharper than interest-rate news alone would suggest.
The BIS discussion of carry-trade measurement also explains why total yen borrowing should not be equated with speculative carry positions. Not every yen loan finances the same strategy. Avoid forecasts that infer an exact liquidation level from aggregate borrowing figures.
4. Intervention and policy surprises
In Japan, the Ministry of Finance decides on foreign-exchange intervention and the Bank of Japan conducts operations as its agent. This division of responsibility is set out in the BoJ’s official explanation of intervention. Intervention is different from changing the monetary-policy rate.
No round number is an official automatic intervention trigger. The speed and disorderliness of a move, policy communication and market conditions matter. Intervention may change positioning abruptly without permanently changing the economic forces behind the exchange rate.
5. Energy, trade and international investment
Changes in import costs, export receipts and investment income can alter currency demand. An energy-price shock can affect Japan’s import bill and inflation at the same time, creating competing pressures on growth and policy. Its currency effect depends on the wider environment rather than a fixed oil-to-yen rule.
Institutional investment decisions also matter. A change in domestic returns or currency-hedging costs can encourage Japanese investors to adjust overseas holdings. Repatriation and hedging are related but different transactions, so a forecast should not assume every portfolio change produces an immediate spot-market purchase of yen.
USD/JPY outlook for 2026 and 2027
The original 150–160 end-2026 scenario assumed that dollar yield support would coexist with limits from Japanese policy normalization and intervention risk. Its usefulness depends on those conditions holding. It should not be used as a current entry range simply because it appears in a forecast table.
The 145–158 scenario for 2027 assumes gradual policy convergence. That could arise through lower US yields, higher Japanese yields or both. A slow narrowing would be consistent with moderate yen recovery; a sharp change in policy expectations could produce a faster move, including an overshoot below the original range.
Conversely, resilient US growth, persistent inflation or slower Japanese policy adjustment could preserve the dollar’s relative return advantage. Under those conditions, the lower-dollar scenario would need reassessment. The direction of the evidence matters more than defending a previously published number.
USD/JPY price prediction for 2030
The original 135–165 structural range is deliberately broad. Over several years, real interest rates, productivity, fiscal credibility and cross-border investment can matter more than the next central-bank meeting. The midpoint is not a precise target, and the range carries no assigned probability.
A stronger-yen outcome would become more plausible if domestic Japanese investment returns improve relative to overseas opportunities and the US real-yield advantage diminishes. A stronger-dollar outcome would become more plausible if US assets retain a durable relative return advantage. Either scenario can be disrupted by geopolitical shocks or a change in the monetary regime.
Demographic trends should be treated as background conditions, not a mechanical currency signal. Aging can affect savings, investment, labor supply and fiscal spending through several channels with different effects on exchange rates.
Bull, base and bear scenarios
| Scenario | Conditions | Evidence that would challenge it |
|---|---|---|
| Bullish USD/JPY | US relative yields rise, dollar demand remains firm and Japanese policy adjustment is slower than expected. | A sustained narrowing of yield differences or a broad unwind of yen-funded positions. |
| Base framework | Gradual policy convergence, with two-way volatility and no decisive regime change. | A persistent policy divergence, recession shock or abrupt capital-flow reversal. |
| Bearish USD/JPY | Japanese relative returns improve, US yields fall or investors reduce yen-funded exposure. | A renewed US yield advantage and sustained demand for dollar assets. |
How to assess the forecast without relying on stale levels
Begin with a current chart and a dated source for economic information. Identify the chart timeframe, major swing highs and lows, and whether price action confirms the macro view. A monthly trend and an intraday breakout answer different questions. A support level from an old chart should not be described as current without checking it again.
Next, use the economic calendar to identify releases that could change rate expectations. Separate an anticipated result from a genuine surprise. Finally, consider whether the expected move is large enough to matter after spreads, financing charges and possible slippage.
A sound economic thesis can still lose money when position size is excessive or timing is poor. Our guide to leverage and margin risk explains why market exposure, rather than the initial deposit alone, determines the scale of price risk.
Forecast methodology and review policy
This is scenario-based editorial analysis. It combines monetary-policy expectations, relative yields, inflation, growth and capital-flow considerations. It is not a backtested forecasting model and does not claim a measured success rate. Official sources support the explanation of market mechanisms; they do not endorse AAFX’s numerical scenarios.
The durable framework is intended for annual review. An earlier review is warranted after a major policy-regime change, significant intervention, a sustained move beyond the scenario ranges or evidence that the main assumptions no longer hold. A review date describes an editorial check, not continuous market monitoring.
Frequently asked questions
Will USD/JPY rise or fall over the long term?
Neither direction is assured. A widening US relative yield advantage can support USD/JPY, while narrowing differentials and stronger yen demand can push it lower. Long-term positioning should consider alternative scenarios and the possibility that the relationships weaken.
What is the USD/JPY forecast for 2027?
AAFX’s September 2026 research used 145–158 as a 2027 scenario range, assuming gradual policy convergence. It is a dated editorial estimate, not a live quote, guaranteed trading range or prediction of a specific closing price.
Can USD/JPY reach 160 or move beyond it?
Yes, exchange rates can move through round-number levels. However, 160 is neither a guaranteed destination nor a fixed official intervention threshold. Assess the economic conditions, pace of the move and current policy communication.
Does a BoJ rate increase always strengthen the yen?
No. If the increase was anticipated, the market may focus on guidance about the next decision. The yen’s response also depends on US rates, relative yields and investor positioning.
Is this a forecast for tomorrow or next week?
No. This page is a long-term scenario guide. A short-term outlook requires current prices, a recent chart and the upcoming event calendar. Annual reviews cannot keep daily targets current.
Revision record
- September 2026: Original scenario ranges recorded: 150–160 for end-2026, 145–158 for 2027 and 135–165 around 2030.
- October 28, 2026: Reworked as an evergreen blog-style guide. Removed stale live-price language and daily targets, clarified scenario dates and limitations, and added sources and related reading. Numerical ranges were preserved as the original research record.
Risk notice: Foreign-exchange trading can cause substantial losses, especially with leverage. Forecasts are uncertain and are not personalized financial advice. Read the AAFX risk disclaimer.