Shiba Inu (SHIB) is showing signs of potential recovery after a turbulent weekend triggered by U.S. airstrikes on Iranian nuclear sites. The meme coin currently trades at $0.0000107, marking a 25% monthly loss, with $242 million in 24-hour trading volume as of June 23.
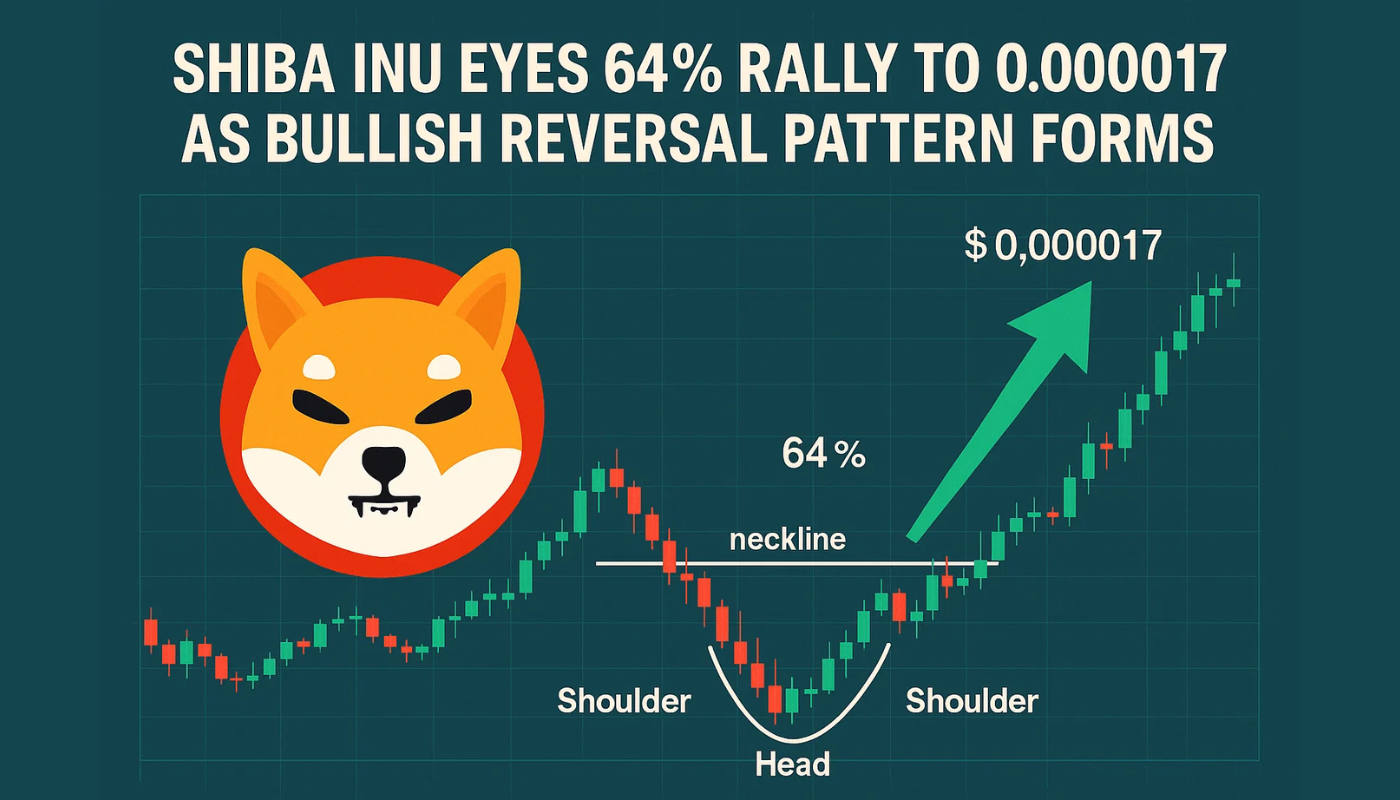
Despite bearish macro sentiment, technical indicators suggest SHIB may be poised for a bullish reversal. The token is forming a double-bottom pattern, historically associated with trend reversals. The $0.0000106 support level—which has held for over a year—has once again proven resilient, with bulls stepping in to defend it.
If Shiba Inu repeats its previous pattern from April 2025, the token could climb toward the $0.000017 neckline resistance. A weekly close above that level would validate the double-bottom formation and set up a potential surge toward $0.0000283, the pattern’s technical target. An extended rally could even test $0.0000322, the high from December 2024.
Key technicals to watch:
- Support: $0.0000106
- Neckline Resistance: $0.0000173
- RSI: 38 (oversold, potential bullish divergence)
- 50-day SMA: Still above current price at $0.0000168
However, until SHIB breaks above its 50-day simple moving average, short-term momentum remains bearish.
Double Bottom Pattern Hints at Upside
The weekly chart outlines a textbook double-bottom pattern, marked by two low points near the same level, separated by a short rally. This structure suggests that selling pressure is waning and buyer interest may be mounting.
For confirmation, technical traders look for:
- A weekly candlestick close above $0.0000173
- Higher lows in RSI to support bullish divergence
- Increased spot volume to validate breakout strength
A breakout above the neckline would require a 64% price increase from current levels, signaling strong upside potential if confirmed.
SHIB Funding Rate Turns Bearish—Or Bullish?
On-chain data from Santiment shows Shiba Inu’s funding rate has turned negative, reaching its lowest level since April. This metric reflects trader sentiment and suggests that short positions now dominate the market.
While typically bearish, this setup could lead to a short squeeze if the price starts rising. Traders forced to close shorts would trigger additional buy pressure, accelerating upward momentum—mirroring what occurred in April during SHIB’s last rally to $0.000017.
In brief:
- Funding rate flips negative—lowest since April
- Short squeeze risk rises if price reverses
- Market setup resembles April’s pre-rally conditions
Conclusion:
Although SHIB has dropped over 25% this month, the formation of a bullish reversal pattern and rising short interest point to a potential recovery. A breakout above $0.000017 remains possible—provided technical conditions align and support holds firm.
Let me know if you’d like a visual chart or social media snippets to go with this piece.
Sources & Methodology
Primary-source standard: Market-moving facts should link to original data releases, regulator notices, company filings or official project announcements whenever available. Secondary reporting is used for additional context, not as a substitute for original evidence.
Page last reviewed: