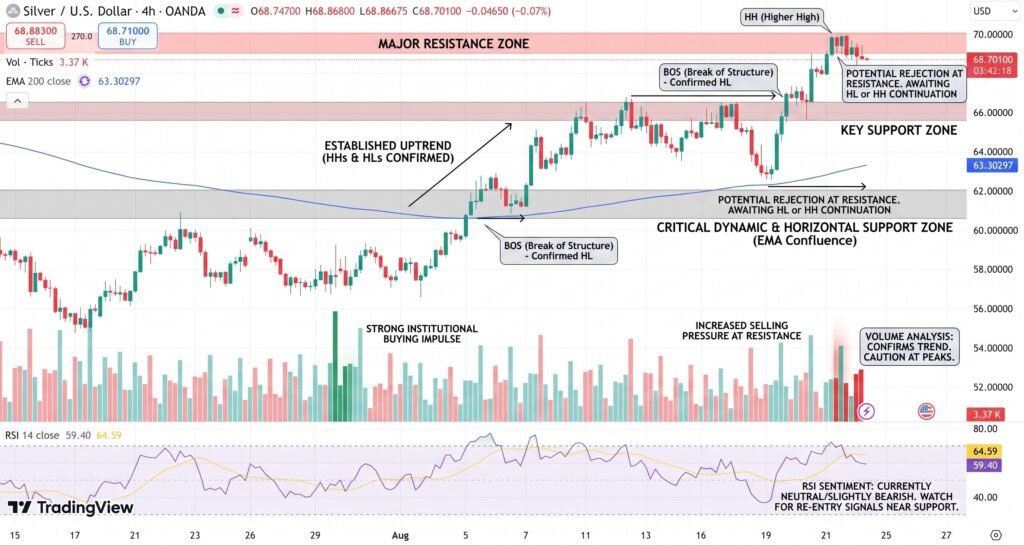
Silver is trading near $69.06 per ounce, testing an important Fibonacci resistance area after an aggressive advance. The five-hour chart remains firmly bullish, with XAG/USD well above its 200-period moving average at $61.10 and short-term trend support near $66.14. Momentum, however, has become unusually stretched. The Money Flow Index has reached 89.1, while silver is testing the 61.8% Fibonacci retracement around $69.15. That combination does not confirm a reversal, but it substantially increases the importance of price action around $69.15-$70.08 before the next directional move develops.
Silver Tests $69.15 Fibonacci Level
Silver’s broader technical structure remains bullish. At $69.06, the metal is roughly 13% above its 200-period moving average at $61.10, demonstrating the strength and speed of the recent advance. Price also remains above shorter-term trend indicators, including the 20-period moving average, SuperTrend and Ichimoku cloud.
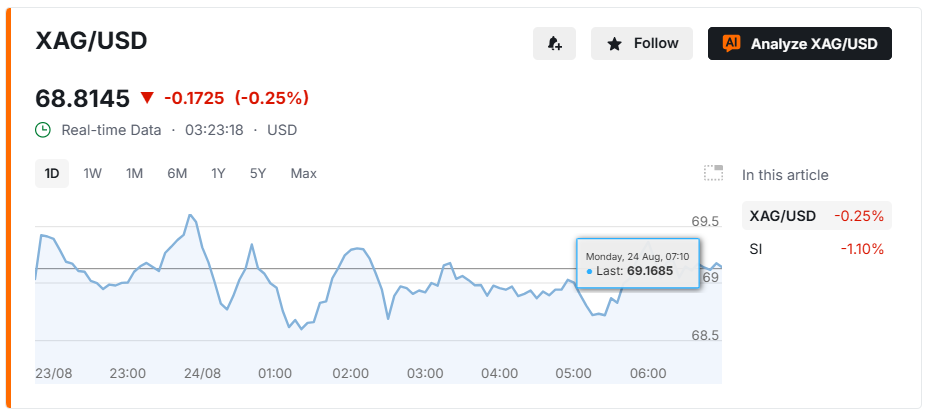
The immediate obstacle is the 61.8% Fibonacci retracement near $69.15. This level has additional significance because recent price action has produced rejection wicks approaching $70.08, indicating that selling pressure has emerged as silver moves toward $70.
The technical picture therefore presents a strong underlying trend confronting increasingly significant overhead resistance. A sustained move above $70.08 would weaken the immediate resistance argument and indicate that buyers remain capable of absorbing supply at higher prices. Repeated failures around $69.15-$70.08 would instead increase the probability of consolidation or a retracement.
MFI at 89 Signals Extreme Momentum
The strongest warning comes from the Money Flow Index, which stands near 89.1 on the five-hour chart. MFI incorporates both price and trading volume to measure buying and selling pressure. Readings above 80 are conventionally considered overbought, making 89.1 an unusually elevated level.
An overbought reading does not mean silver must immediately fall. During powerful trends, momentum indicators can remain elevated while prices continue rising. It does show that buyers have pushed the market rapidly higher and that the probability of larger short-term price swings has increased.
The five-hour Average True Range near $1.03 reinforces that point. At a silver price of $69.06, that represents approximately 1.5% of price per five-hour period, indicating substantial short-term volatility.
The most important technical levels are:
- $70.08: Recent high and immediate breakout resistance.
- $69.15: 61.8% Fibonacci resistance.
- $67.02: First meaningful support area.
- $66.14: Major short-term trend support.
- $61.10: 200-period SMA and longer-term trend reference.
$66.14 Support Protects Uptrend
If silver fails to break $69.15-$70.08, the $66.14-$67.02 region becomes the most important area to monitor. This zone contains several technical indicators, including short-term moving-average, SuperTrend and Ichimoku support. Previous trading volume was also concentrated around approximately $66-$68, increasing the technical significance of the region.
A controlled retracement that remains above $66.14 would leave the broader five-hour uptrend intact. A decisive break below roughly $66, by contrast, would indicate that the latest bullish structure has weakened considerably.
Silver’s fundamental backdrop also remains important. The metal is influenced by both investment demand and industrial consumption, particularly from the solar, electronics and electrification sectors. The Silver Institute has documented several consecutive years of structural market deficits, meaning total demand has exceeded newly available supply.
At the same time, silver remains highly sensitive to the U.S. Dollar, Treasury yields and expectations for Federal Reserve policy. Those macroeconomic variables can amplify technical moves when positioning becomes as stretched as current indicators suggest.
Conclusion
Silver’s move to $69.06 confirms that buyers remain in control of the broader five-hour trend, but momentum is now exceptionally elevated. The 89.1 MFI reading and 61.8% Fibonacci resistance at $69.15 make the $69.15-$70.08 region the immediate technical test. A confirmed break above $70.08 would strengthen the continuation case, while repeated rejection would increase the probability of a move toward $67.02-$66.14. The key distinction is that overbought conditions signal elevated risk, not an automatic reversal. Until trend support breaks, the underlying structure remains bullish.
Sources & Methodology
Primary-source standard: Market-moving facts should link to original data releases, regulator notices, company filings or official project announcements whenever available. Secondary reporting is used for additional context, not as a substitute for original evidence.
Page last reviewed: