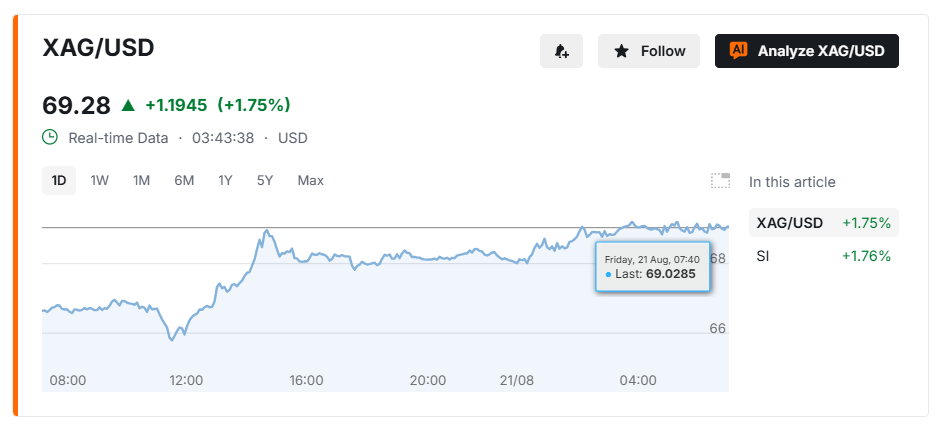
Silver changed hands near $69 an ounce on Friday, after Thursday’s COMEX settlement at $68.03 and a two-day climb of more than $4. Spot prints ran as high as about $69.20. That leaves the metal roughly 1% under $70, a round number the source five-hour chart treats as the 61.8% Fibonacci retracement of the prior decline. From July’s settlement low near $56, the rebound is on the order of 25%. The 52-week high is still far above, about $115 on the COMEX front month in January and higher on some spot series. $70 is a test of the bounce, not a new cycle high.
$70 Aligns With a Fibonacci Test
Fibonacci levels are a map of where algorithms and discretionary books often rest orders. They are not a law. The coincidence of a 61.8% retracement with a round handle is why $70 is the level that matters on this window. Five-hour RSI near 66 is elevated but not at the 70 extreme. Price is a few percent above a short 20-period average. Average true range near $1.07 says a single session can travel from $69 to either side of the handle.
Support on that same chart sits near $65.80–$66.15, where a SuperTrend line and the 20-period average cluster. A five-hour close through $70 would open the next measured zone toward the mid-$74s on that retracement set. A rejection that loses $66 would argue the V-shaped recovery from the mid-$60s has failed at the first obvious supply. Neither outcome is implied by the last print at $69.
The Rally Rode Cheaper Long Yields
Silver did not rise in a vacuum. The same Treasury decision that doubled long-dated buybacks pulled the 30-year yield back from about 5.34% and lifted gold toward $4,500. Silver, as usual, moved more. COMEX silver’s Thursday gain of 3.5% was its largest one-day rise since Aug. 4. Month-to-date the contract is up about 18%. Year-to-date it is still slightly negative versus January.
A weaker dollar helps dollar-priced metal. So does any bid that treats silver as a high-beta cousin of gold. Industrial demand does not explain a 25% bounce in a month. Positioning and the yield shock do. That also means a reversal in long yields can take the same percentage back.
A Close Through $70 Would Matter
The five-hour structure is a near-complete V from the mid-August dip through $63. The last stretch into $70 is where late buyers and fading shorts meet. Volume should rise if the handle is tested. A single wick above $70 that fails is not a breakout. A settlement through it, with the short averages still rising, would be the first evidence that supply at the Fib line has been absorbed.
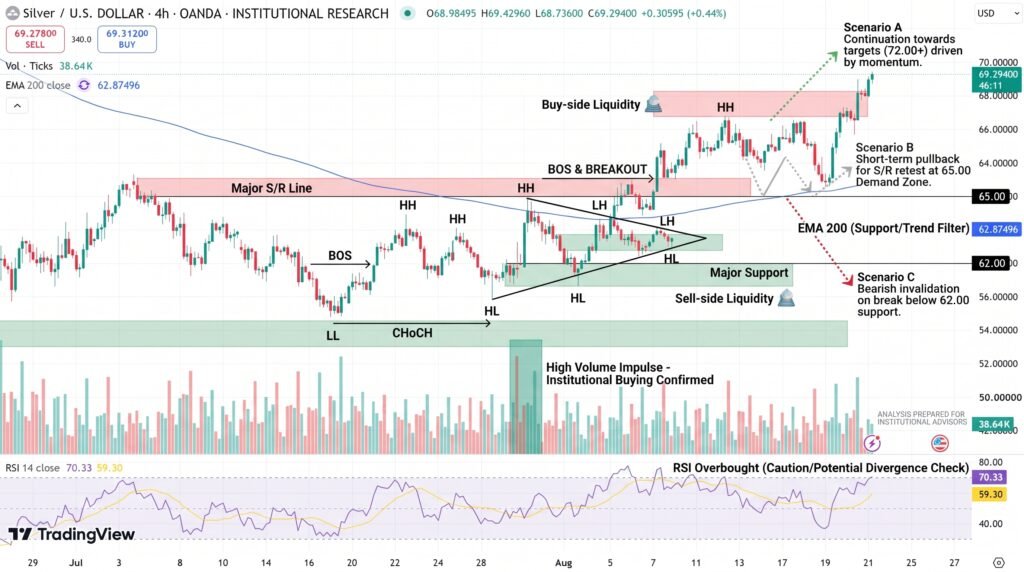
The no-trade band on that chart, roughly $67 to $69, is simply the last two dollars of the approach. It is noisy because both sides already have inventory there. The useful information is still a close outside $66 or $70, not another hour inside $69.
Conclusion
Silver at $69 is a 25% recovery pressed against a round number that also marks a 61.8% retracement. The fundamental bid is cheaper long-term money and a gold tape that has already run. It is not a completed trend change versus January’s $115 high. Watch a five-hour or daily close through $70, and whether $66 holds if that test fails. Until one of those prints, $70 is resistance by construction, not a launch price.
Sources & Methodology
Primary-source standard: Market-moving facts should link to original data releases, regulator notices, company filings or official project announcements whenever available. Secondary reporting is used for additional context, not as a substitute for original evidence.
Page last reviewed: