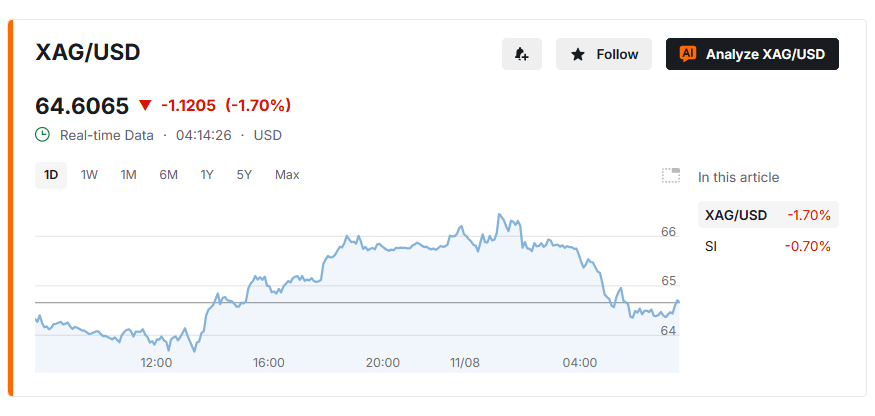
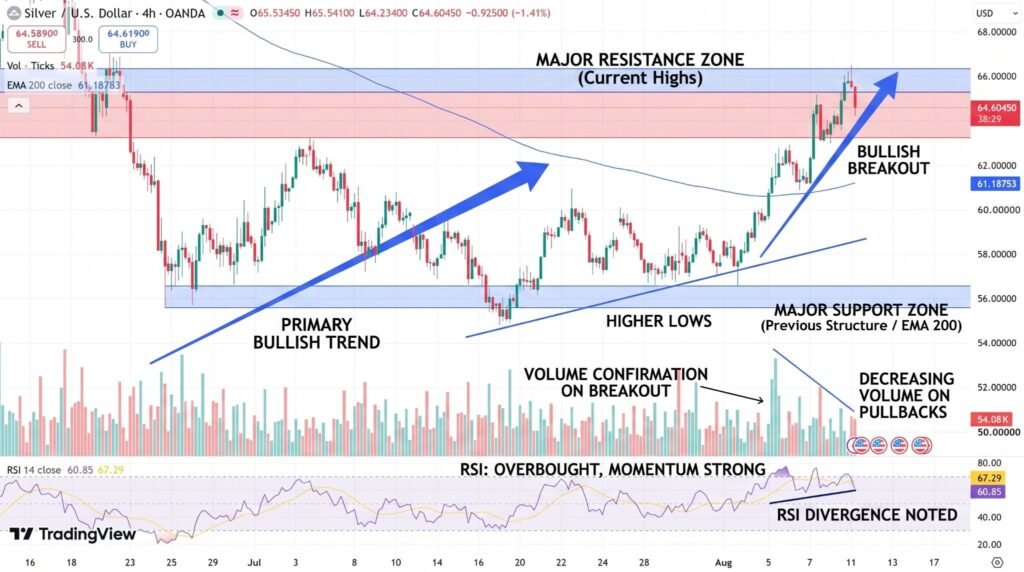
Silver climbed to $64.74 on the 5-hour chart Monday, rallying more than 6% above its 200-period moving average of $60.64 before a rejection near $66.67 signaled the trend may be overheating. The metal reached its highest level in seven weeks, supported by a weaker dollar, safe-haven demand tied to Middle East tensions, and robust industrial buying out of China. The question now is whether $62.96 holds as support or whether the sharp rally gives way to a pullback first.
A Confirmed Breakout Now Pausing for Breath
Silver broke out of a multi-week consolidation base near $55, a rounding-bottom pattern that traders view as a classic setup before a sustained move higher. The breakout carried price decisively above its 200-period simple moving average, confirming a shift in trend from range-bound to bullish. That momentum has since cooled: the Relative Strength Index has eased back from overbought territory to 62.72, and trading volume, which surged during the initial breakout, has begun flattening as $64.74 becomes the market’s new pivot point.
Source: investing.com
A SuperTrend indicator marks support at $62.96, with bulls remaining in control as long as price holds above that level. Fibonacci retracement levels offer the next reference points on any deeper pullback, with the 38.2% level at $62.22 and the 50% level at $60.83 both aligning closely with the underlying 200-period moving average.
Source: investing.com
Trade Setups for Both Bulls and Bears
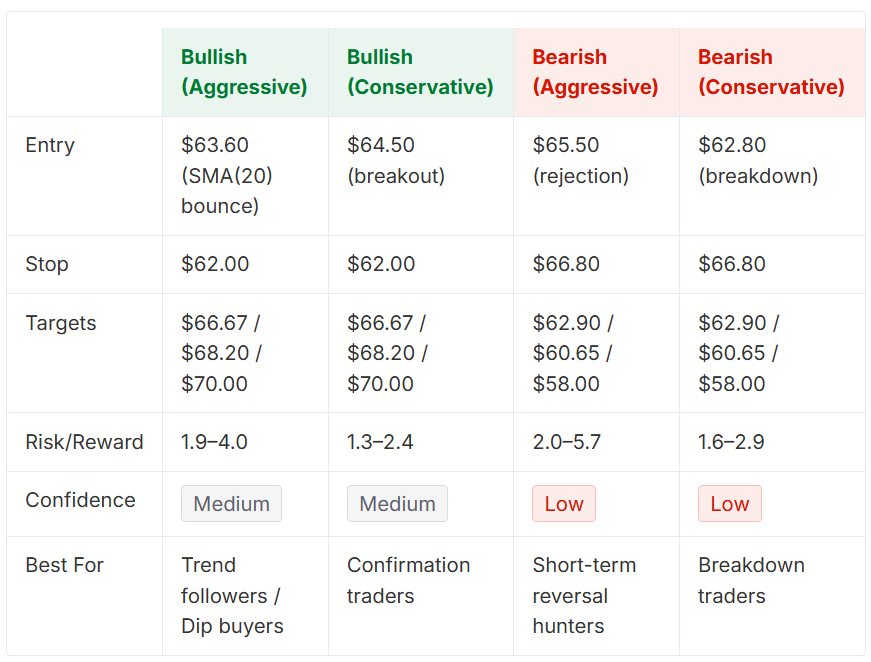
The current setup splits into two competing views, each with a defined risk line. Bulls betting on trend continuation are watching $62.96 as their line in the sand, treating dips toward $63.60 as opportunities to add to positions if volume returns to confirm the move. Bears are playing for mean reversion, arguing that after a sharp 6.7% rally, momentum is fading and profit-taking could accelerate if price loses the $62.96 level. The average true range currently sits at 1.07, meaning a typical five-hour price swing runs about $1.07, a useful gauge for setting realistic stop-loss distances in either direction.
The $63.60 to $65.50 zone stands out as a no-trade area, prone to whipsaws that punish traders on both sides rather than confirming a clear direction. A daily close below $62.96 would put the bull thesis on hold and likely expose $60.65 near the 200-period moving average. Conversely, a close back above $65.50 would fade the bearish case quickly and set up a retest of $66.67, with $68 or higher becoming plausible if that level clears.
Silver’s advance has also been reinforced by fundamentals beyond the chart. Chinese imports of silver-bearing ores rose 62.5% year-over-year in June to 219,000 tonnes, reflecting expanding demand tied to solar panel and electricity grid production, a trend that has provided a steady floor under prices even during short-term pullbacks.
Conclusion
Silver’s rally reflects a genuine trend shift rather than a short-lived spike, but the pace of the move, more than 6% above its 200-period average in a matter of days, leaves the market vulnerable to a mean-reversion pullback before the next leg higher. Traders on either side have clear levels to work with: $62.96 as the line that keeps the bull case intact, and $65.50 to $66.67 as the zone that would need to break to reopen the path toward $68 and beyond. Chasing the move at current levels offers a weaker risk-to-reward setup than waiting for price to test one of those defined levels first.
Sources & Methodology
Primary-source standard: Market-moving facts should link to original data releases, regulator notices, company filings or official project announcements whenever available. Secondary reporting is used for additional context, not as a substitute for original evidence.
Page last reviewed: