Solana is trading around $69 after holding above its $60 support level, but the recovery still looks weak from a technical perspective. The token has not yet moved back above the key moving averages that usually signal a lasting trend change. There is strong resistance near $74, which will be the next big challenge for buyers. This rebound comes after eight straight months of losses, the longest losing streak in Solana’s history, so the current bounce seems more like a pause than a true reversal.
SOL Holds $60 as $74 Wall Builds
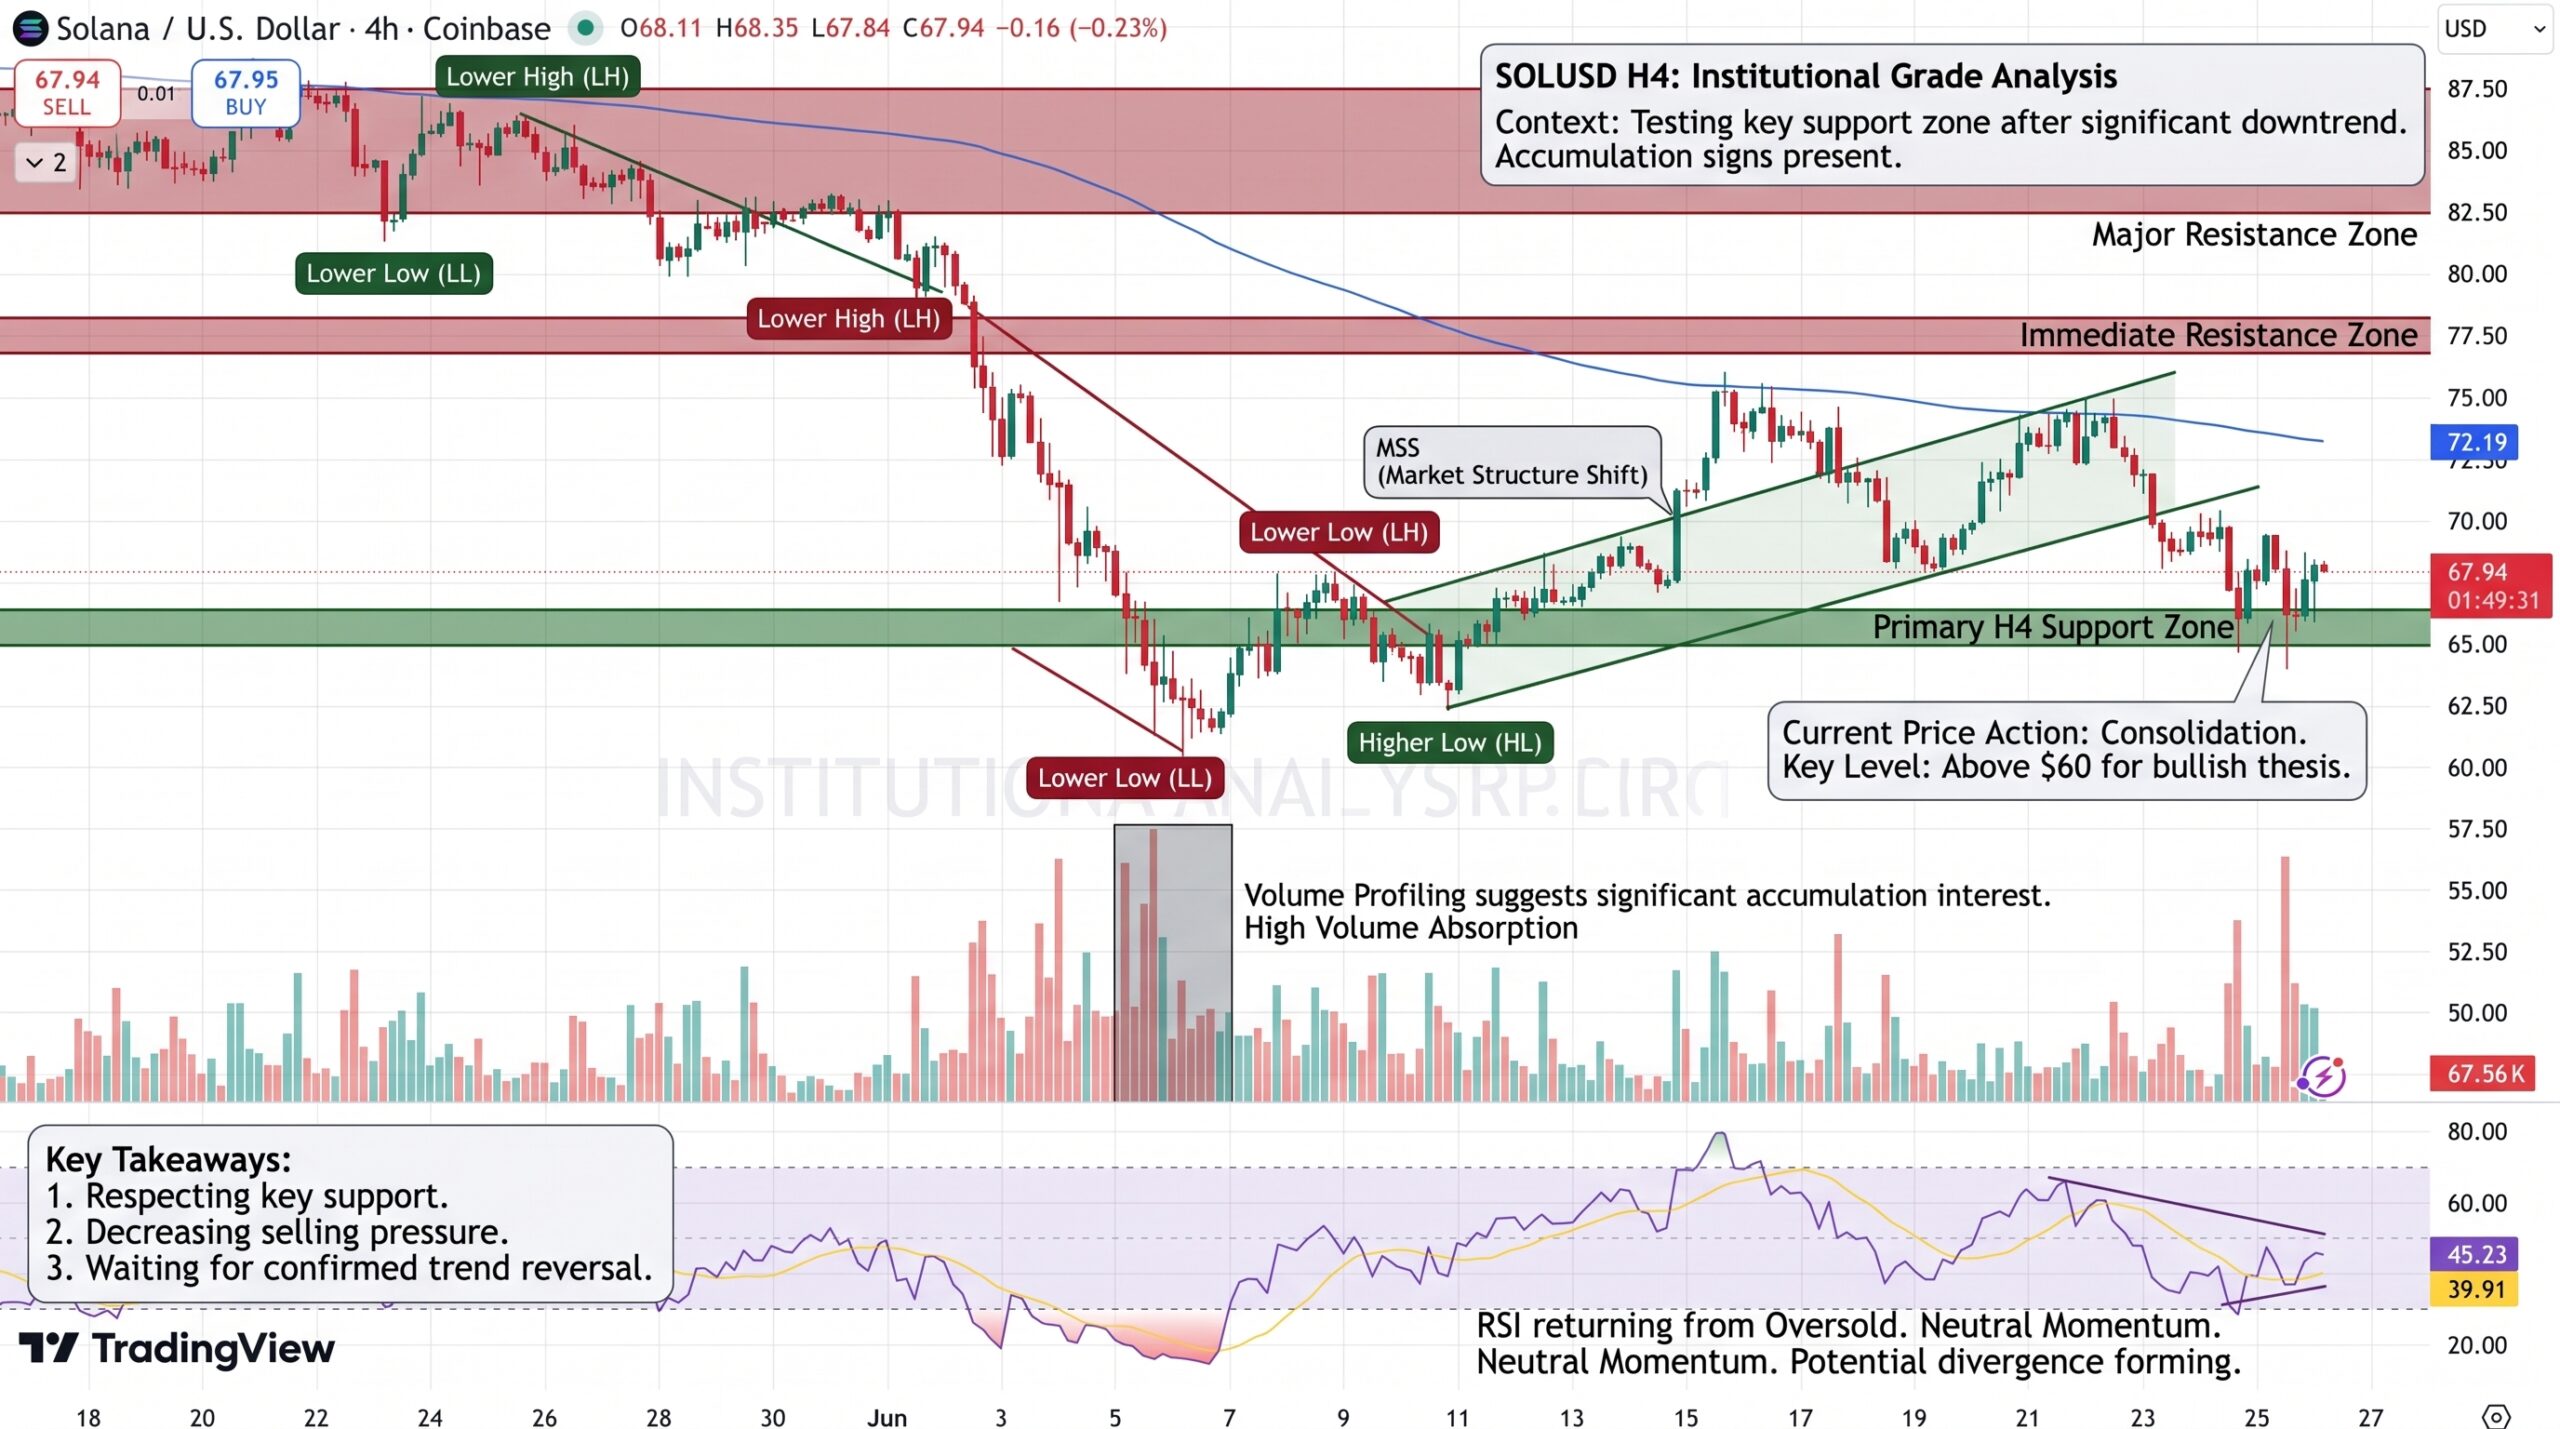
Last week, buyers kept Solana above $60, which led to a trading range between $64 and $69. However, this move did not have enough volume or strength to change the overall downward trend. Solana is still trading below its 50-day, 100-day, and 200-day exponential moving averages, which now act as resistance instead of support.
The first major barrier is around $74.75. If Solana can break above this level, it could move toward the 50-day EMA at $76.18 and then to $79.27, which is an important Fibonacci retracement. For a stronger rally, the price would need to rise above the 100-day EMA near $83.03 before sellers lose their grip on the market.
Derivatives Data Still Favors Bears
Futures data shows traders are cautious. CoinGlass reports that Solana’s long-to-short ratio fell to 0.94 on Thursday, so there are now more short positions than long ones. Funding rates have also turned negative, around -0.0080%, which means short sellers are paying to keep their trades open. This usually suggests that traders expect prices to fall further.
Analysts have also noticed a symmetrical wedge pattern, which shows that volatility is tightening just below the 200-day EMA near $74. Momentum indicators back up this cautious outlook: the 4-hour MACD shows the price is consolidating, and the RSI is around 46, just below the neutral level of 50.
ETF Flows Offer a Mixed Signal
Not all the news is negative. Spot Solana ETFs saw $137,290 in net inflows, which is a small but steady sign that institutions are still interested, even as the overall market trends lower.
Key levels traders are watching:
- Support: $68 must hold to avoid a slide toward $62–$63
- Resistance: A daily close above $71 would weaken the bearish setup
- Breakdown risk: A failure below $60.80 could expose the $40–$50 accumulation zone
Macro events add another layer of uncertainty. Upcoming U.S. GDP and PCE inflation data could shift risk appetite across crypto markets broadly, with weaker readings likely to pressure Solana alongside other major altcoins. For now, the market’s central question is straightforward: can Solana defend $68 long enough to mount a real challenge at $74, or does the eight-month losing streak extend further?