The US Dollar Index trades near 101.15 in early European hours Friday, slipping on the day but remaining on track for a second straight weekly gain. Higher US Treasury yields and expectations for additional Federal Reserve tightening have kept the greenback near its strongest levels in roughly two months. Traders are also watching further Fed commentary for clues on the next policy move.
The Federal Reserve raised its federal funds target range by 25 basis points on September 16 to 3.75%-4.00%, citing elevated inflation. The next scheduled FOMC meeting is October 27-28.
The rise in long-term borrowing costs has reinforced the dollar’s yield advantage. The source market data showed the 30-year Treasury yield reaching 5.502% and the 10-year yield climbing to 5.225%, levels not seen in many years.
- DXY: Around 101.15
- Fed funds target: 3.75%-4.00%
- Immediate resistance: 101.35
- Key support: 100.00
Fed Outlook Keeps DXY Supported
Expectations for another Fed increase have become an important driver of the dollar. Markets have been reassessing the possibility of another hike after the September policy decision, while Fed officials continue to emphasize inflation risks. Investors remain focused on the possibility of another rate increase before year-end.
Higher policy expectations can support the dollar by lifting short-term yields and increasing the relative attractiveness of US-denominated assets. However, the currency also faces competing factors, including concerns about the US fiscal outlook and uncertainty surrounding trade and economic policy.
The Treasury market is particularly important because higher long-term yields can influence currency demand through global asset-allocation decisions. The recent rise in yields has therefore reinforced the broader dollar move rather than acting as an isolated bond-market development.
101.35 Resistance Caps Upside
From a technical analysis perspective, the US Dollar Index retains a constructive structure. DXY is trading above the 20-day simple moving average and the 100-day moving average, keeping the broader short-term trend tilted higher.
However, momentum is becoming stretched. The 14-period Relative Strength Index is around 70.5, placing the index in overbought territory and raising the possibility of a consolidation phase if buying pressure fades.
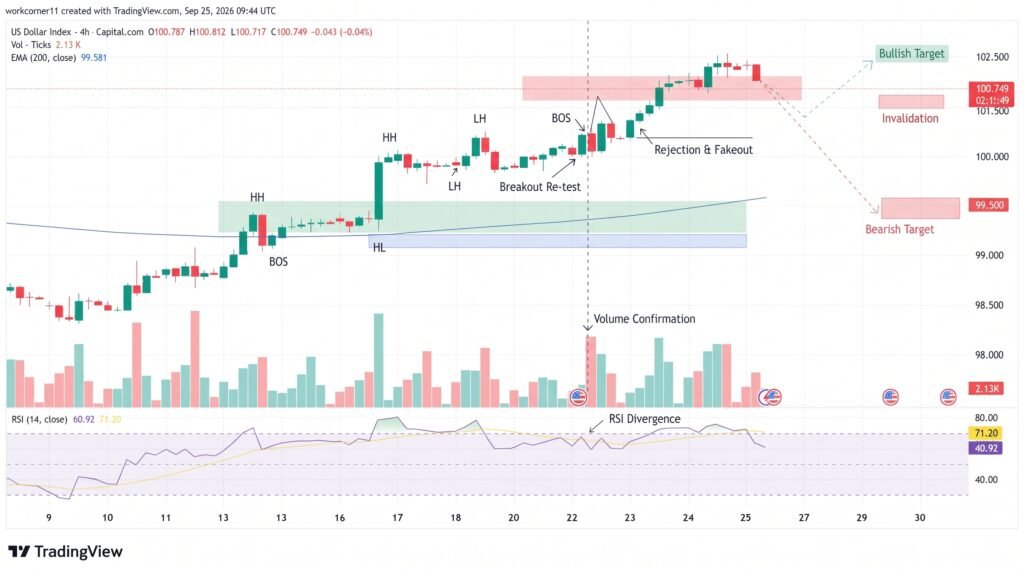
The main technical levels are:
- Immediate resistance: 101.35
- June 24 high: 101.80
- Psychological resistance: 102.00
- 100-day moving average: 100.00
- 20-day SMA: 99.80
- September 9 low: 98.60
- Lower Bollinger Band: 98.22
A sustained move above 101.35 could expose 101.80 and then the 102.00 psychological barrier. Conversely, a break below 100.00 would shift attention toward 99.80, while a deeper decline could bring 98.60 and 98.22 into focus.
Conclusion
The US Dollar Index remains above 101.00 as higher Treasury yields and expectations for further Fed tightening support demand for the greenback. The September Fed hike has already lifted the policy range to 3.75%-4.00%, while the October 27-28 meeting is the next major policy event. Technically, 101.35 is the immediate upside barrier, followed by 101.80 and 102.00. On the downside, 100.00 and 99.80 provide the first important support zone, while an RSI near 70.5 shows that momentum is already stretched.
Sources & Methodology
Primary-source standard: Market-moving facts should link to original data releases, regulator notices, company filings or official project announcements whenever available. Secondary reporting is used for additional context, not as a substitute for original evidence.
Page last reviewed: