
USD/CAD is pulling back for a second consecutive session, trading around 1.4210 during Asian hours Friday after reaching an 18-month high near 1.4263 on Thursday. The Canadian dollar remains under pressure as the U.S. dollar benefits from stronger Treasury yields and a widening policy-rate gap. The Bank of Canada has kept its overnight rate at 2.25%, while the Federal Reserve’s target range is 3.75%-4.00%.
USD/CAD Tests Key Technical Levels
The daily chart continues to show an ascending-channel structure, with USD/CAD trading above its nine- and 50-day exponential moving averages. The nine-day EMA is near 1.4157, keeping the immediate technical structure constructive while the pair remains above that level.
The 14-day Relative Strength Index is around 74, placing momentum in overbought territory. That does not necessarily signal an immediate reversal, but it indicates that the recent advance has become extended and leaves the pair vulnerable to a deeper pullback if buyers fail to regain the recent high.
The key levels for traders include:
- Resistance: 1.4262, followed by 1.4270 and 1.4300.
- Support: 1.4157, followed by the 50-day EMA near 1.4000.
A sustained move above 1.4270 would take USD/CAD beyond the upper boundary of the ascending channel and expose the psychological 1.4300 level. Conversely, a break below 1.4157 would weaken the short-term structure and bring the lower channel boundary and 1.4000 region into focus.
Rate Gap Keeps Pressure on CAD
The monetary-policy gap remains an important driver for the currency pair. The Bank of Canada held its policy rate at 2.25% on Sept. 2 and is scheduled to announce its next decision on Oct. 28. The central bank has also highlighted elevated oil prices, trade uncertainty and inflation risks linked to energy costs.
Meanwhile, the Federal Reserve raised its policy range by 25 basis points in September to 3.75%-4.00%. On Oct. 1, Dallas Fed President Lorie Logan said she believes rates need to rise by another 50 basis points or more to make policy “modestly restrictive” and return inflation toward the Fed’s 2% target.
That stance contrasts with the Bank of Canada’s current 2.25% rate and helps explain why wider U.S.-Canada yield differentials are weighing on the Canadian dollar. The Bank of Canada’s own July assessment noted that higher U.S. bond yields had contributed to Canadian-dollar depreciation.
Jobs Data Could Drive Dollar Volatility
The next major catalyst is the U.S. September employment report. Markets are watching payroll growth, unemployment and wage data for evidence about how much additional tightening the Federal Reserve may ultimately deliver.
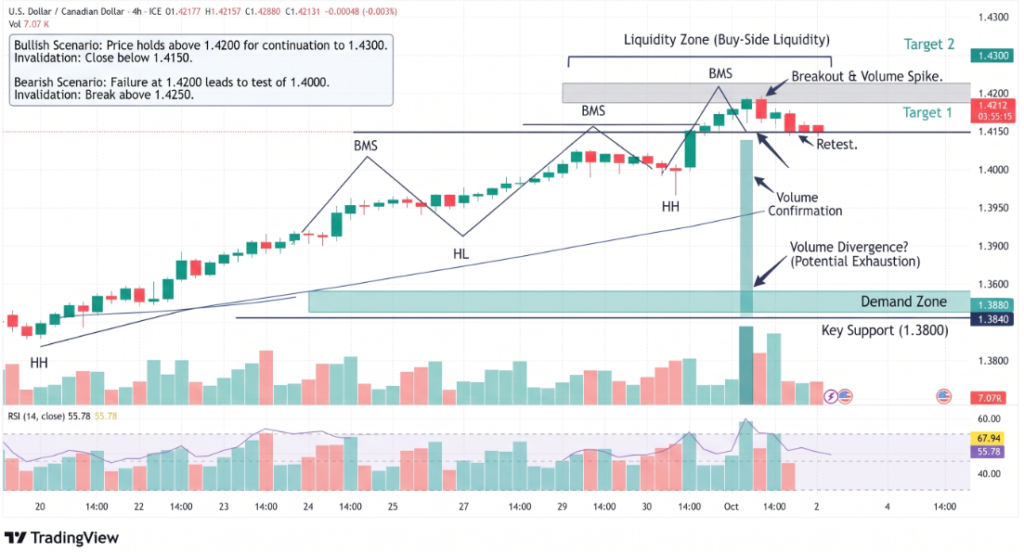
A stronger-than-expected employment report could reinforce the dollar’s recent momentum and keep USD/CAD near its highs. A weaker reading could reduce expectations for further Fed tightening and give the Canadian dollar room to recover.
Conclusion
USD/CAD remains technically supported while trading above its short-term moving averages, but the RSI near 74 shows that momentum is stretched. The 1.4262-1.4270 area is the immediate upside zone, while 1.4157 is the first important downside level. Beyond the chart, the 1.50-percentage-point gap between the Fed’s target range midpoint and the Bank of Canada’s policy rate remains a central factor for the pair.
Sources & Methodology
Primary-source standard: Market-moving facts should link to original data releases, regulator notices, company filings or official project announcements whenever available. Secondary reporting is used for additional context, not as a substitute for original evidence.
Page last reviewed: