
WTI crude oil is consolidating near $103.31 after a powerful rally pushed prices toward the $104.95 high. The five-hour chart shows a market pausing close to the top of its recent range, with a doji signaling hesitation and momentum indicators losing some strength. The next decisive move could determine whether the rally extends or enters a deeper correction.
The pause comes as the wider oil market remains heavily influenced by supply disruptions. Reuters reported Tuesday that West Texas Intermediate climbed to about $103.27, while Brent crude reached $107.55 after fresh attacks disrupted Saudi energy infrastructure.
Rally Pauses Near $105
WTI remains in a strong technical structure, with the 20-, 50- and 200-period SMAs still arranged in bullish order. That alignment indicates that the broader trend remains positive even as short-term momentum cools.
The latest doji near $103.31 highlights the current balance between buyers and sellers. WTI reached approximately $104.95 before retreating, and the inability to immediately clear that level has created a short-term test of bullish conviction.
The Relative Strength Index (RSI) has slipped to 66.47 from overbought territory. That is still consistent with strong momentum, but it suggests buying pressure is no longer accelerating at the same pace as during the earlier advance.
The MACD has also turned bearish in the supplied setup. Combined with thinner trading volume, that raises the probability of additional sideways movement before the next directional break.
Supply Risks Keep Oil Elevated
The fundamental backdrop remains supportive for crude prices. Saudi Arabia’s East-West pipeline, which can move about 4 million barrels per day to the Red Sea port of Yanbu, remains offline after attacks, putting roughly 4% of global oil supply capacity at risk.
The disruption is particularly important because shipping through the Strait of Hormuz has also fallen sharply. The waterway previously handled about one-fifth of global oil supplies, making any prolonged reduction in traffic a significant risk to international energy markets.
The supply shock is also feeding inflation concerns. The U.S. 10-year Treasury yield reached 5.0266% Tuesday, its highest level since 2007, while markets were pricing a 93% probability of a Federal Reserve rate increase at Wednesday’s meeting.
That creates an important counterforce for oil. Higher rates and a stronger dollar can restrain demand, particularly outside the United States, even as geopolitical disruptions support crude prices.
U.S. production provides another offset. The Energy Information Administration expects American crude output to average a record 13.8 million barrels per day in 2026, above the previous 2025 record of 13.7 million barrels per day.
$104.95 Break or $97.88 Failure?
The immediate technical battle is concentrated between $97.88 and $104.95. The lower zone combines the supplied SuperTrend, Ichimoku Cloud and Fibonacci support near $97.71–$97.88, creating a strong technical cushion.
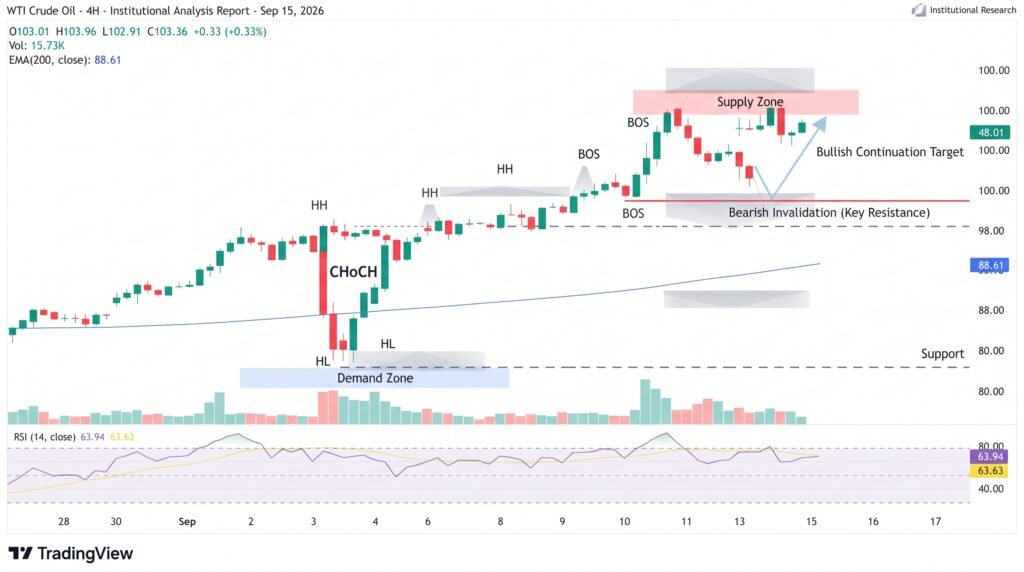
The key levels are:
- Major resistance: $104.95
- Near-term support: $100.65
- Primary support: $97.88
- Fibonacci support: $97.71
A decisive close above $104.95 would confirm that buyers have absorbed the recent selling and could open the way toward new highs. Conversely, a move below $97.88 would weaken the bullish structure and expose a deeper mean-reversion phase.
The $101–$104 area remains vulnerable to choppy trading. With RSI elevated and MACD weakening, chasing either direction inside this range carries greater false-breakout risk.
Conclusion
WTI is holding near $103.31, but the rally is approaching a critical decision point below $104.95. The bullish moving-average structure and severe Middle East supply risks continue to favor higher prices, while fading MACD momentum, easing RSI and a stronger dollar argue for caution. A confirmed break above $104.95 would reinforce the bullish trend. A sustained move below $97.88, however, would signal that the rally is losing its technical foundation and increase the risk of a deeper correction.
Sources & Methodology
Primary-source standard: Market-moving facts should link to original data releases, regulator notices, company filings or official project announcements whenever available. Secondary reporting is used for additional context, not as a substitute for original evidence.
Page last reviewed: