
West Texas Intermediate traded near $85 a barrel on Thursday, little changed after Wednesday’s settlement at $85.83, the highest since July 24. Spot quotes ran closer to $84.30–$84.70. Brent held above $91.60 and toward $92. The tape is not a clean trend. On shorter charts, futures have spent hours in a high-volume band between about $84 and $86. That is the range traders must resolve before the next $3 move. A prior peak near $88.07 is the level that would confirm, or reject, a double top.
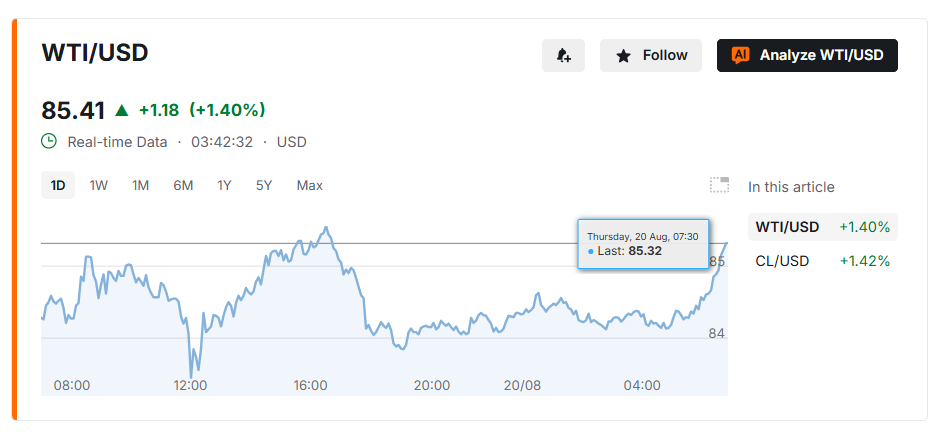
Price Stuck Between $84 and $86
WTI is still well above its longer-term average. A commonly watched 200-period moving average on the five-hour chart sits near $78.15. Price above that line keeps the intermediate recovery intact. It does not make the last few sessions a trend.
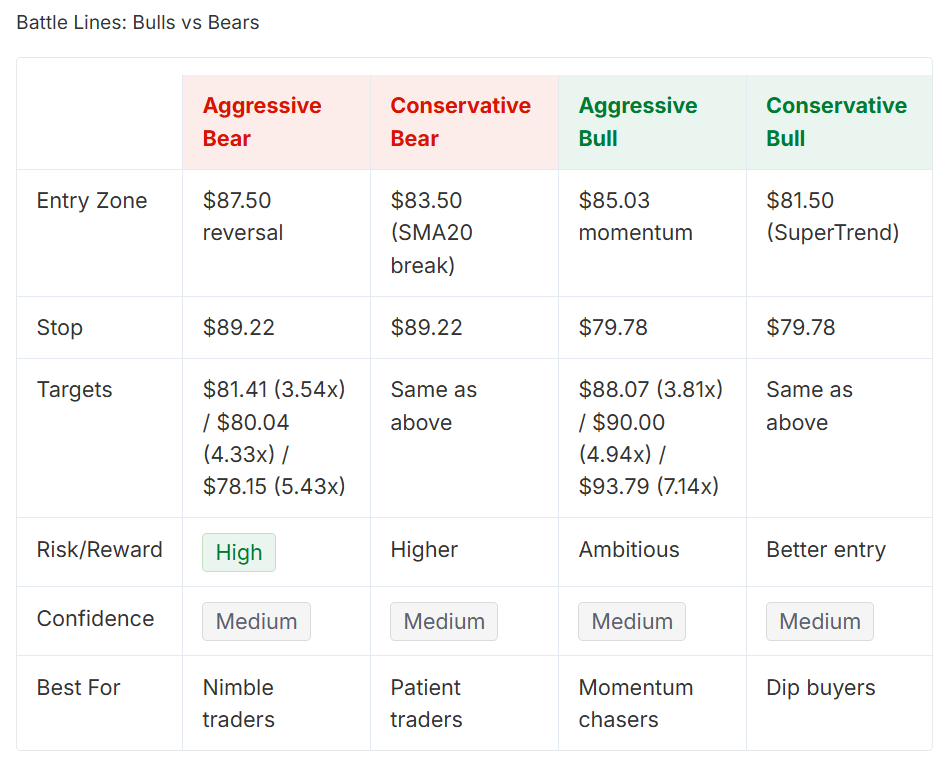
Average directional movement on that same window has been near 19, a reading associated with a weak or absent trend. The money-flow index has been stretched toward 80, which is overbought on that scale. Neither figure is a forecast. Together they describe a market that has already paid up inside a narrow band and has not yet chosen a direction.
Intraday range on Thursday was tight, roughly $84.25 to $85.90 on the front futures. Wednesday’s high reached about $85.84. That is a stall, not a breakout. Volume has clustered at current prices, which usually means larger accounts are still building or reducing inventory rather than chasing.
Why $88.07 Matters for Bears
The $88.07 area is not an arbitrary round number. It is a recent swing high on the same contract family and the level a double-top thesis needs to fail. A close through it would undercut the bear case on this time frame. A probe into that zone that is rejected would complete the pattern and put $83.50–$81.40 back in view.
A widely used SuperTrend line near $81.41 is the other bookend. A daily close under that mark would end the case that the bounce from the low-$70s is still in force. Average true range near $1.15 means a single session can travel from the middle of the current coil to either boundary.
- Resistance: $88.07; a close above it breaks the double-top read
- Coil: $83.50–$86.00, where signals have been noisy
- Support: $81.41 SuperTrend; below that the bounce is spent
- Brent: about $91.60–$92.20, also a four-week high
Those are map points, not orders.
Hormuz Premium Meets Chart Fatigue
The fundamental bid has not gone away. A 60-day U.S.-Iran pause expired this week. Tehran and Washington still disagree on whether the Strait of Hormuz is open. Kpler counted only six commodity vessels on one recent day against a 10-day average of 11. The UAE has suspended financial and economic dealings with Iran. About one-fifth of seaborne oil and LNG used to pass Hormuz before the latest war.
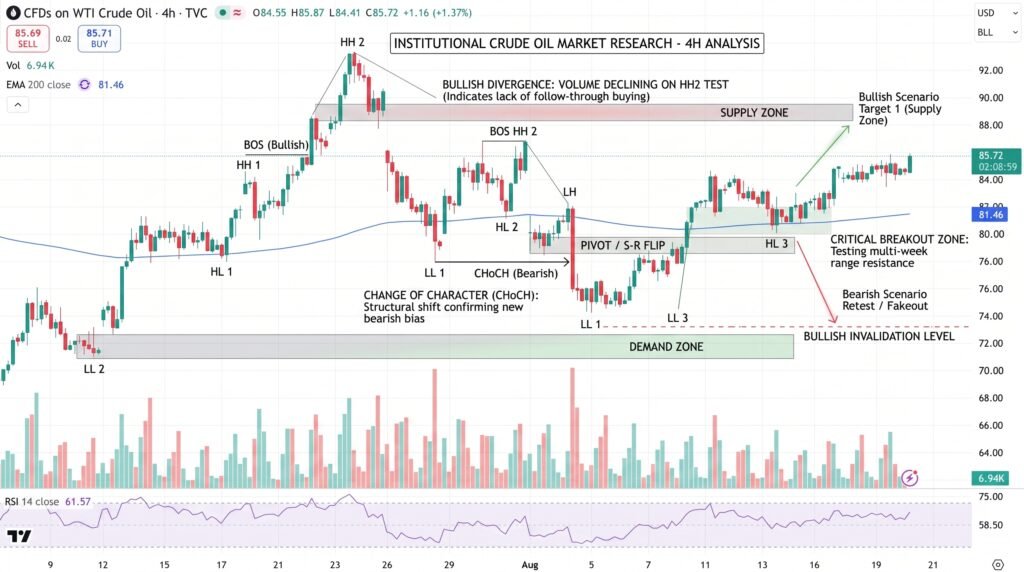
JPMorgan has said each extra month of disruption could add $7–$8 to Brent. Goldman Sachs has put $120 in play if the strait stays impaired, while keeping an easing of tensions as its base case. That premium can hold WTI in the mid-$80s even when the five-hour chart looks exhausted. It can also fade if shipping normalizes and the $88 test fails.
Conclusion
WTI at $85 is a standoff: a four-week high against a ceiling at $88.07, weak trend strength, and stretched short-horizon money flow. The next useful information is a close outside $83.50–$86.00, not another hour inside it. If price tags $88 and reverses, the double top is the working map. If it clears $88.07 on a settlement, the Hormuz premium has more room. Until one of those happens, the range is the story.
Sources & Methodology
Primary-source standard: Market-moving facts should link to original data releases, regulator notices, company filings or official project announcements whenever available. Secondary reporting is used for additional context, not as a substitute for original evidence.
Page last reviewed: