
Ripple’s XRP and Stellar’s XLM edged higher on Tuesday, trading around $1.359 and $0.191, respectively, after losses in the previous session. Derivatives positioning offered a modest sign of improving sentiment, but technical indicators continued to point to weak momentum. Both cryptocurrencies remain below important moving averages, leaving their recoveries vulnerable unless buyers overcome nearby resistance. Traders are now watching whether XRP can defend $1.339 and whether XLM holds its rising trendline near $0.189.
Derivatives Signal Cautious Optimism
Data from CoinGlass showed long-to-short ratios of 1.09 for XRP and 1.08 for XLM on Tuesday. Readings above one indicate that long positions outnumber short positions within the measured group of traders. Although this points to a mildly bullish tilt, it does not guarantee that prices will rise.
Funding rates offered a more mixed picture. XRP’s funding rate stood at -0.0055%, meaning short positions were paying long positions under the applicable funding arrangement. Negative funding can reflect bearish positioning, although it is not a reliable standalone price signal.
XLM’s funding rate was positive at 0.0042%, indicating that long positions were paying shorts. This suggests stronger demand to maintain bullish exposure, but persistently positive funding can also increase the risk of crowded trades.
The contrasting signals highlight the need to assess derivatives alongside spot prices and technical levels. Neither token has yet confirmed a sustained reversal.
XRP Price Forecast: Resistance Near $1.395
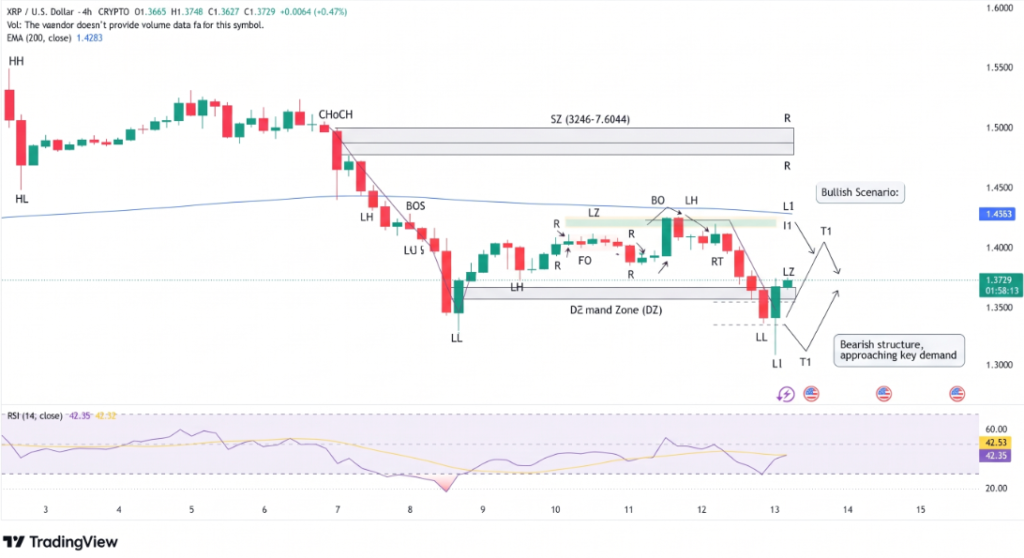
XRP traded around $1.359, below its 200-day exponential moving average (EMA) at $1.381 and its 50-day EMA at $1.395. However, the token remained above its 100-day EMA at $1.339, which serves as immediate technical support.
The Relative Strength Index (RSI) near 40 indicates subdued momentum, while the Moving Average Convergence Divergence (MACD) remained negative. Together, these indicators suggest sellers retain an advantage.
Key XRP levels include:
- Support: $1.339, followed by $1.300.
- Resistance: $1.381 and $1.395.
- Lower support: $1.000 if selling accelerates.
- Higher barriers: $1.671 and $1.900.
A sustained break below $1.300 could expose XRP to a deeper correction. Conversely, reclaiming both major moving averages would strengthen the recovery case.
XLM Price Forecast: $0.189 in Focus
Stellar traded near $0.191, around its 100-day EMA and below its 200-day EMA at $0.193. The 50-day EMA at $0.198 represents another resistance level. Meanwhile, an RSI near 43 and a negative MACD indicate that bullish momentum remains limited.
The rising trendline around $0.189 is the immediate level to watch. Holding above it could allow XLM to challenge $0.193 and $0.198, with $0.234 as a higher resistance target. A breakdown could expose support at $0.177, followed by $0.142.
Conclusion
XRP and XLM are showing early signs of stabilization, but their recoveries remain unconfirmed. Derivatives ratios favor buyers slightly, while funding rates and momentum indicators reveal important differences between the two assets. XRP needs to defend $1.339, while XLM must hold $0.189. A sustained move above their respective resistance levels would provide stronger evidence of recovery; failure to maintain support could renew selling pressure.
Sources & Methodology
Primary-source standard: Market-moving facts should link to original data releases, regulator notices, company filings or official project announcements whenever available. Secondary reporting is used for additional context, not as a substitute for original evidence.
Page last reviewed: