
Dogecoin (DOGE) attempted a recovery on Tuesday after touching $0.0800, following a 5% decline in the previous session. However, weakening demand for Dogecoin exchange-traded funds (ETFs) and declining whale holdings continue to weigh on market sentiment. DOGE traded near $0.0829, below key moving averages, leaving its short-term outlook vulnerable. A decisive break beneath $0.0800 could expose the meme coin to further losses toward $0.0683, representing a potential decline of more than 15% from the critical support level.
ETF Outflows Weigh on Dogecoin Demand
Investor flows are adding pressure to Dogecoin as traders reassess exposure to speculative digital assets. According to the reported ETF flow data, DOGE-focused funds recorded $399,460 in net outflows on Monday, reversing the neutral flow position reported for the previous week.
ETF outflows indicate that redemptions exceeded new investment during the reporting period. While one day’s movement does not establish a sustained trend, the withdrawals suggest limited institutional demand at a time when DOGE is struggling to maintain important price levels.
On-chain data presents another concern. Figures attributed to Santiment show that wallets holding more than 100 million DOGE controlled 69.74% of the circulating supply, down from 70.02% on September 1.
The decline suggests that this large-holder group has reduced its share of the supply. However, wallet distribution alone cannot establish whether investors sold tokens or transferred them between addresses.
These factors leave Dogecoin exposed to further volatility as market participants assess whether buyers will defend the $0.0800 threshold.
DOGE Technical Analysis: Key Levels
DOGE’s technical indicators point to continued downside risk. At approximately $0.0829, the token remains below its 50-day exponential moving average (EMA) at $0.0876 and its 200-day EMA at $0.0923. These averages represent potential resistance levels during a recovery.
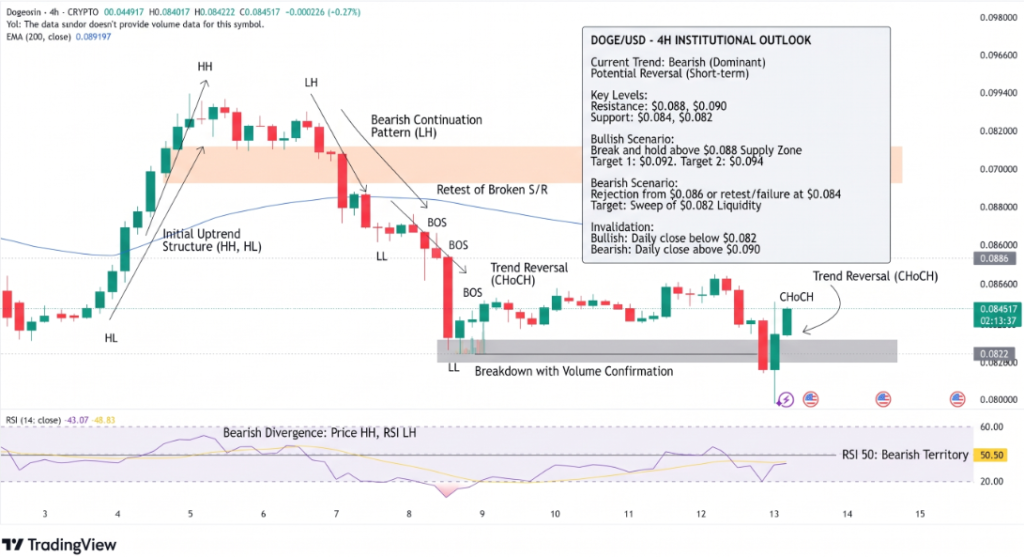
The Moving Average Convergence Divergence (MACD) has moved below zero, indicating weakening momentum. Meanwhile, the Relative Strength Index (RSI) is near 39, showing that selling pressure dominates, although the indicator has not yet reached the commonly used oversold threshold of 30.
Traders are watching three important price levels:
- Support at $0.0800: A break below this level could accelerate selling.
- Downside target at $0.0683: This July 23 low represents the next major support area.
- Resistance at $0.0876–$0.0923: The 50-day and 200-day EMAs could limit a rebound.
A confirmed breakdown below $0.0800 would put the $0.0683 target in focus. Conversely, a recovery above $0.0876 could signal improving momentum, although a move through $0.0923 would provide stronger evidence of a recovery.
Conclusion
Dogecoin remains under pressure as ETF outflows, changes in large-holder supply and bearish technical signals converge near $0.0800. A sustained break below support could open the way toward $0.0683, while a rebound above the 50-day EMA would offer an initial sign of stabilization. Traders should monitor trading volume and confirmation around these levels before drawing conclusions about DOGE’s next major move.
Sources & Methodology
Primary-source standard: Market-moving facts should link to original data releases, regulator notices, company filings or official project announcements whenever available. Secondary reporting is used for additional context, not as a substitute for original evidence.
Page last reviewed: