
Pi Network (PI) remained under pressure on Monday, trading just above $0.0800 as weakening futures activity and bearish chart signals pointed to fragile investor demand. Data from CoinAnk showed PI futures open interest falling to $8.86 million from $10.52 million the previous week. Meanwhile, social media attention increased, suggesting that heightened discussion has not translated into stronger speculative positioning. Traders are now watching whether the $0.0800 support level can hold or whether another decline could expose the token’s previous low near $0.0704.
Retail Activity Weakens as Buzz Rises
The decline in futures open interest indicates that the notional value of outstanding PI futures contracts has decreased. Open interest can fall when traders close positions or when market liquidations reduce exposure. It does not, by itself, prove that retail investors are abandoning the market, but it points to a reduction in outstanding speculative positions.
CoinAnk data cited in the October 12 market report put open interest at $8.86 million, down from $10.52 million a week earlier. That represents a decline of approximately 15.8%, highlighting a cooling derivatives market as PI struggles to maintain its price.
Social activity moved in the opposite direction. According to Santiment, PI’s social dominance rose to 0.36% on Sunday from 0.06% on Thursday. Social dominance measures an asset’s share of discussion across tracked crypto-related social conversations. Rising attention can reflect renewed interest, but it does not necessarily indicate buying pressure. In a falling market, it may also reflect concern or speculation about further losses.
This divergence between social engagement and futures positioning leaves PI vulnerable unless stronger demand emerges.
PI Technical Levels to Watch
PI remains below its 50-day and 200-day exponential moving averages (EMAs), positioned near $0.0889 and $0.1230, respectively. The token is also trading beneath a descending trendline around $0.0880, reinforcing the near-term bearish structure.
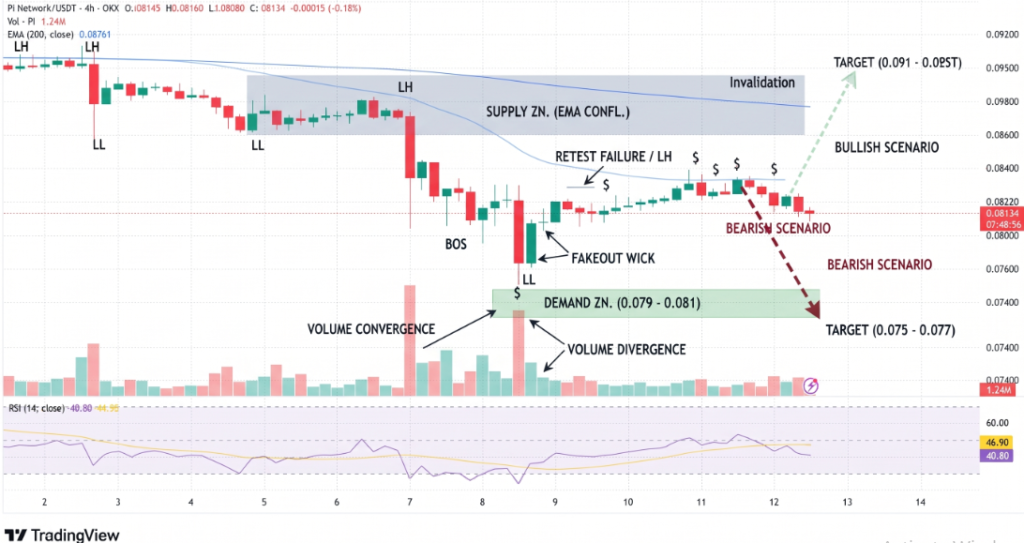
The Relative Strength Index (RSI) stands at 39, below the neutral 50 threshold, while the Moving Average Convergence Divergence (MACD) remains slightly negative. Together, these readings suggest that sellers retain the advantage.
Key levels to monitor include:
- Immediate support: $0.0800, near the July 31 low.
- Downside target: $0.0704 if support breaks decisively.
- Initial resistance: $0.0866–$0.0889, covering Fibonacci resistance, the descending trendline and the 50-day EMA.
- Higher resistance: $0.1049, near the 50% Fibonacci retracement.
A sustained daily close above the resistance band would improve the recovery outlook. Until then, rebounds may face selling pressure.
Conclusion
Pi Network’s outlook remains bearish as futures open interest declines and technical indicators show weak momentum. The $0.0800 level is the immediate test: a confirmed break could expose $0.0704, while a recovery above $0.0889 would provide an initial sign of improving strength. Rising social attention alone is insufficient to confirm a reversal. Traders should watch price action, derivatives activity and whether buyers can reclaim key resistance levels
Sources & Methodology
Primary-source standard: Market-moving facts should link to original data releases, regulator notices, company filings or official project announcements whenever available. Secondary reporting is used for additional context, not as a substitute for original evidence.
Page last reviewed: