
The British pound (GBP) surged against the U.S. dollar (USD) on Monday, decisively breaking above the 1.3500 mark. Growing concerns over U.S.-China trade frictions and cautious market sentiment weighed heavily on the dollar, boosting the GBP/USD pair ahead of key U.S. economic data.
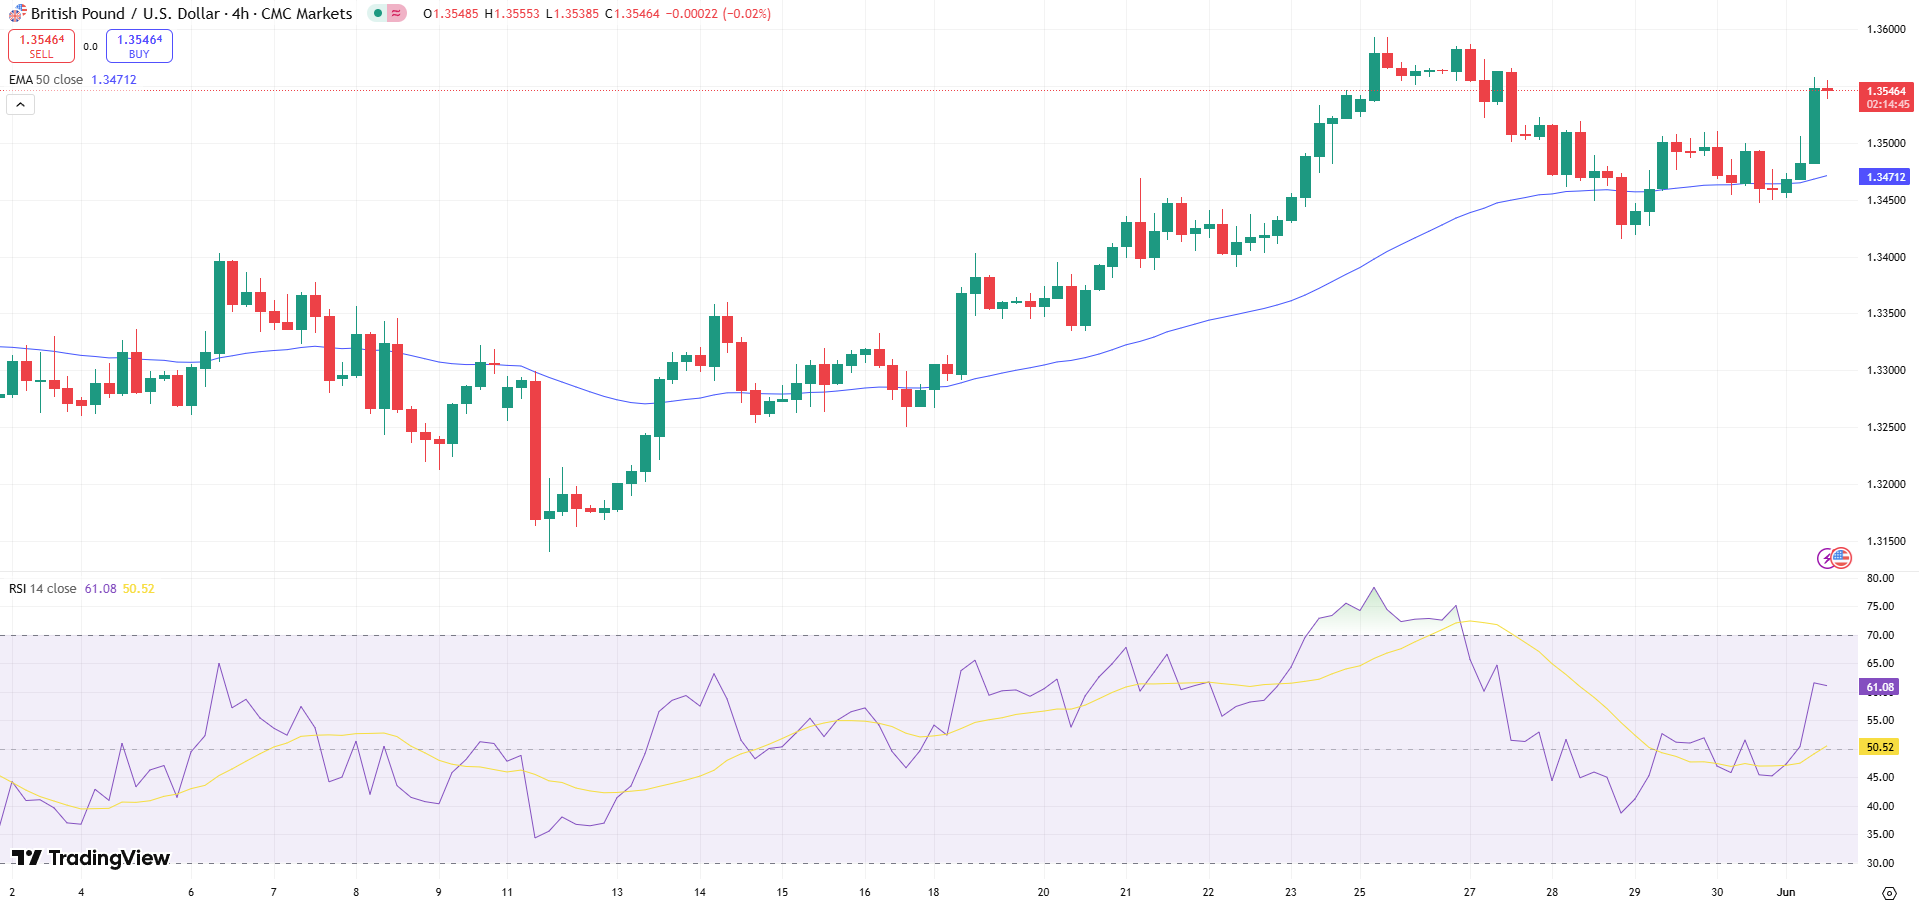
At the time of writing, GBP/USD was trading within the upper half of an ascending regression channel, reflecting a bullish bias. The Relative Strength Index (RSI) on the 4-hour chart stood above 60, confirming positive momentum for the pound.
- GBP/USD breaks above 1.3500, signaling bullish momentum
- RSI above 60 indicates strong near-term demand
- Markets eye resistance at 1.3590–1.3600
Key Technical Levels to Watch
Traders are closely monitoring upcoming resistance and support levels. Should the bullish momentum persist, the pair is likely to face resistance at the 1.3590–1.3600 zone, which includes a multi-year high and a static level. A further rally could target the 1.3700 mark, followed by the upper boundary of the channel at 1.3750.
However, should the USD regain some footing, GBP/USD may encounter support around:
- 1.3520 (mid-point of the channel)
- 1.3480–1.3470 (50- and 20-period SMAs)
- 1.3400 (static level, 100-period SMA)
Market Sentiment and Upcoming US PMI Data
The dollar’s weakness stems largely from escalating U.S.-China trade tensions. On Friday, President Donald Trump accused China of violating its trade agreement, prompting a sharp rebuttal from the Chinese Ministry of Commerce on Monday. The ministry claimed that the U.S. had breached the 90-day trade truce by implementing discriminatory measures, distorting the facts, and falsely blaming China.
Reflecting broader market caution, U.S. stock index futures were down between 0.4% and 0.6% in pre-market trading. If Wall Street opens on a bearish note, the USD could face further pressure, potentially driving GBP/USD higher.
Traders are also bracing for the release of the Institute for Supply Management’s (ISM) Manufacturing PMI for May. Forecasts point to a modest uptick to 49.5 from April’s 48.7, but a reading above 50 could signal expansion in the manufacturing sector and provide temporary support for the dollar. Conversely, a disappointing result could extend the dollar’s slump and fuel further gains for the pound.
Would you like me to illustrate this with a chart showing GBP/USD’s technical levels and key resistance zones?