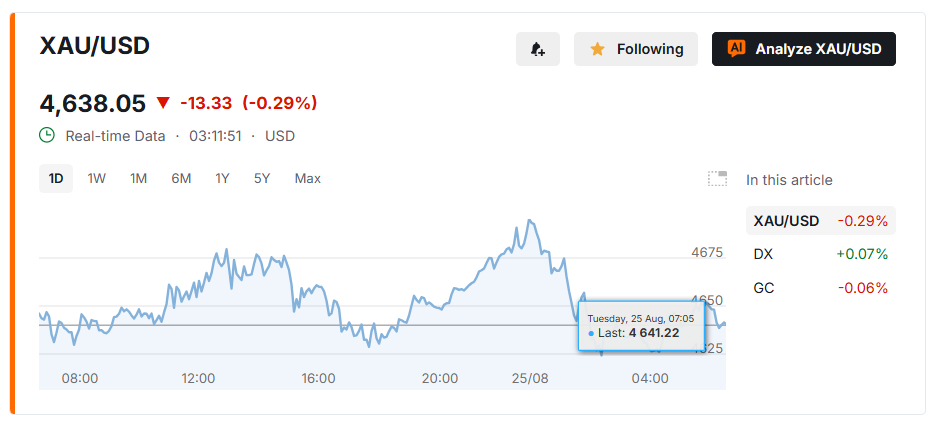
Gold dipped 0.3% on Tuesday after touching $4,689 an ounce, its highest level since May, as traders booked profits ahead of two events that could reshape the rally: fresh U.S. inflation data and Federal Reserve Chair Kevin Warsh’s first Jackson Hole speech since taking over from Jerome Powell in May. The metal has gained more than 5% over the past three weeks on renewed fears about U.S. debt sustainability.
Treasury Buybacks Fuel Fiscal Worries
Gold’s advance traces directly to an Aug. 19 announcement from the U.S. Treasury, which said it would double its buybacks of long-dated government bonds, running from Sept. 9 through Nov. 4, with purchases likely to exceed $4 billion. The move came days after the 30-year Treasury yield spiked to 5.337%, its highest level in 19 years.
The buyback plan pulled that yield back down, but it hit the dollar instead. The U.S. Dollar Index sank to 98.723, its lowest level since May 14, and it has since stayed near that mark even as Treasury yields fully recovered to their pre-announcement levels. Treasury Secretary Scott Bessent said he remains prepared to expand buybacks further and confirmed the administration will soon unveil a separate fiscal initiative aimed at easing government borrowing costs.
This dynamic has revived what traders call the “debasement trade,” the same pattern that drove gold’s roughly 65% gain in 2025. The reasoning: when officials manage the symptoms of rising debt rather than reduce it, investors rotate into gold as protection against a weaker dollar. The concern has real numbers behind it. U.S. national debt has crossed $40 trillion, and the Congressional Budget Office projects net interest payments will exceed $1 trillion this year, about 19% of federal revenue, rising toward 4.6% of GDP by 2036.
Markets are now watching two upcoming catalysts:
- U.S. inflation data, which could reinforce bets on a Fed pause if it comes in soft
- Warsh’s Jackson Hole address on Aug. 28, delivered three weeks before the September Fed meeting
Trade Friction Adds to Safe-Haven Demand
Trade tensions are compounding the fiscal story. Talks between the U.S. and Canada collapsed last weekend, and Washington responded with 50% tariffs on roughly $20 billion of Canadian goods, including wine, cement and hockey sticks. President Trump has separately threatened to raise tariffs on all Canadian cars, trucks, auto parts and steel to 50% starting Jan. 1, 2027, a rate that would apply on top of an industry already built on parts crossing the border multiple times during assembly. Canada has said it will impose retaliatory tariffs of its own beginning Sept. 8.
Washington has also threatened economic penalties against countries that continue trading with Iran, part of a broader campaign to isolate Tehran. Combined with the fiscal picture, these pressures are testing gold’s role as a portfolio hedge against currency, trade and policy risk simultaneously.
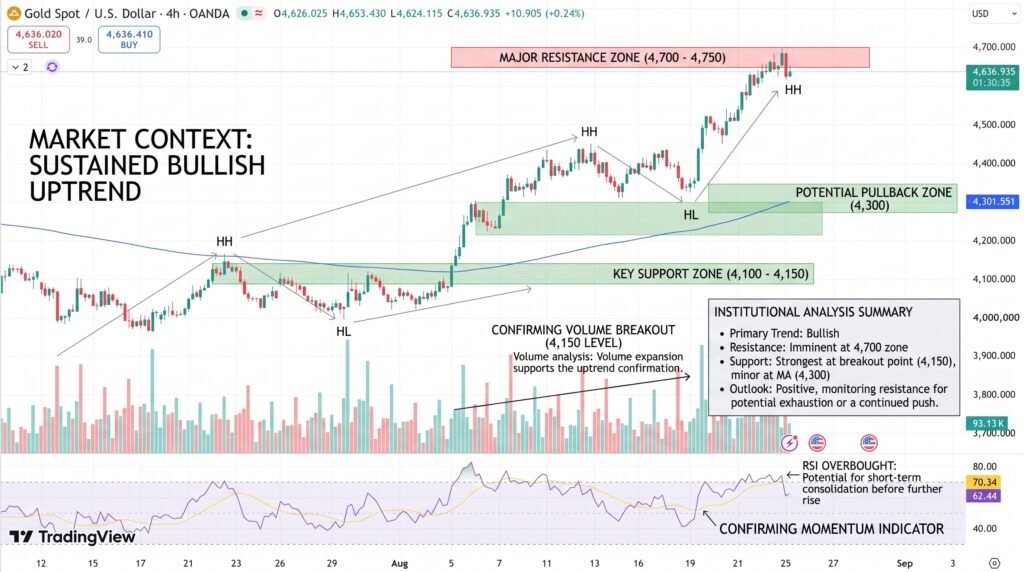
On the charts, gold has cleared trendline resistance near $4,420 and its 200-day moving average around $4,515, a technically bullish signal. Analysts including IG’s Tony Sycamore see the metal targeting resistance near $4,900 to $5,000, with Morgan Stanley forecasting $5,000 by 2027.
Conclusion
Gold’s pullback on Tuesday looks like profit-taking, not a reversal. The forces behind the rally, fiscal strain, a weakened dollar and escalating trade disputes, remain firmly in place. Warsh’s Friday speech is now the key swing factor: a dovish tone could push gold toward $5,000, while a hawkish surprise would test the metal’s ability to hold its recent gains without the support of yield.
Sources & Methodology
Primary-source standard: Market-moving facts should link to original data releases, regulator notices, company filings or official project announcements whenever available. Secondary reporting is used for additional context, not as a substitute for original evidence.
Page last reviewed: