
Silver remains under heavy selling pressure on the five-hour chart, with prices near $49.09 testing support after an extended decline. The metal’s Relative Strength Index (RSI) has fallen to 26.89, placing it in technically oversold territory. Yet the broader trend remains firmly bearish: the Average Directional Index (ADX) stands at 44, while silver trades below its 20-, 50- and 200-period moving averages. The immediate question is whether buyers can defend $48.89 or whether another breakdown will extend the decline.
Silver bears retain technical control
The supplied five-hour chart shows a clear bearish alignment. Silver at $49.09 trades below the 20-period Simple Moving Average (SMA) at $51.49, the 50-period SMA at $53.82 and the 200-period SMA at $60.43. This configuration indicates that selling pressure extends beyond the immediate trading session and has affected the broader trend.
The Ichimoku cloud, positioned between $50.95 and $53.82, provides another resistance zone. Silver remains below the cloud, suggesting buyers have yet to regain control of the market structure.
The ADX reading of 44 reinforces the strength of the prevailing trend. ADX measures trend intensity rather than direction, but its elevated reading, combined with the falling moving averages, supports the bearish interpretation. The MACD histogram at -0.05 indicates that negative momentum may be easing slightly, although it has not turned positive.
External market conditions also remain challenging. Silver fell about 3% on November 3 as precious metals faced pressure from expectations of tighter US monetary policy and renewed inflation concerns linked to higher oil prices.
Oversold signals put $48.89 in focus
The RSI at 26.89 is below the conventional 30 threshold, indicating an oversold market. This can increase the probability of a short-term rebound, but it does not establish that a durable bottom has formed. In a strong downtrend, prices can remain oversold for an extended period.
Silver is also approaching the lower Bollinger Band at $48.15. A doji candle around $49.09 on November 3 suggests indecision near recent lows, while declining volume points to weaker participation in the latest move.
The main levels to monitor are:
- Immediate support: $48.89
- Lower support: $48.15, the lower Bollinger Band
- First resistance: $50.50–$51.49
- Trend resistance: $51.82
- Higher resistance: $53.82
- Fibonacci levels: $57.40 and $60.03
The Fibonacci retracements are measured from the supplied swing high of $71.16 to the low of $48.89. A sustained break beneath $48.89 would expose further downside, while a quick recovery above $49.10 after a brief dip could indicate a potential bear trap.
Silver outlook: Rebound or breakdown?
The preferred bearish setup in the supplied analysis is to wait for a recovery into the $50.50–$51.80 resistance band before assessing another move lower. This area combines the 20-period SMA, Ichimoku-related resistance and other short-term technical barriers.
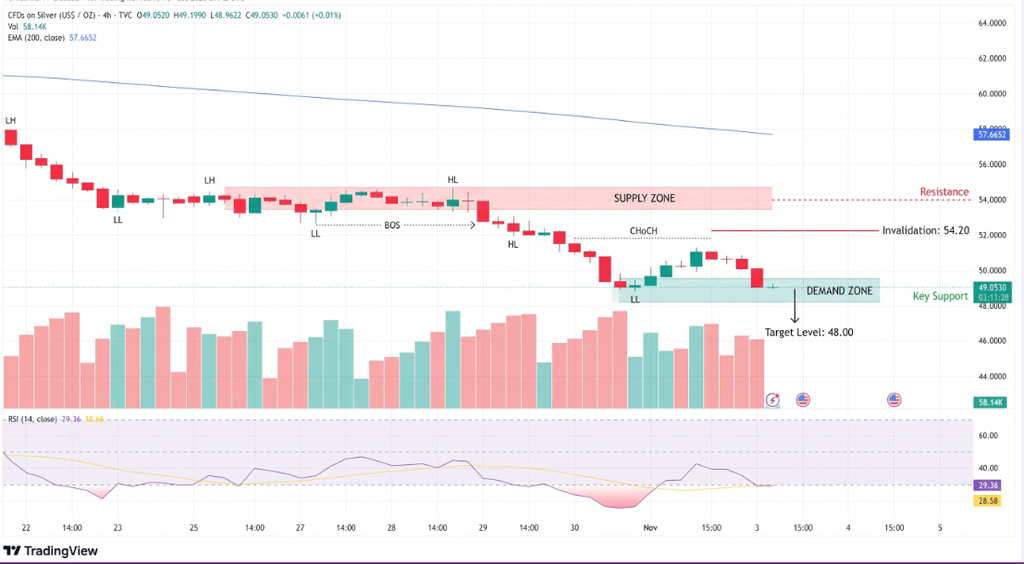
The bullish case requires evidence that sellers are losing control. A sustained move above $51.82 would invalidate the immediate bearish structure and improve the prospects of a deeper recovery. Until then, rallies remain vulnerable to renewed selling.
Conclusion
Silver’s oversold RSI creates scope for a technical bounce, but the ADX reading and bearish moving-average alignment show that the dominant trend remains downward. The $48.89 low is the critical support level. A confirmed break could extend losses, while a recovery above $51.82 would provide the first meaningful evidence of a change in short-term direction.
Sources & Methodology
Primary-source standard: Market-moving facts should link to original data releases, regulator notices, company filings or official project announcements whenever available. Secondary reporting is used for additional context, not as a substitute for original evidence.
Page last reviewed: