
Bitcoin trades near $79,000 after an intraday spike to $81,023 this week pushed its price to its highest opening level in more than three months. The move tracks rising bets that the Federal Reserve will ease policy following this week’s Jackson Hole symposium, alongside renewed optimism around U.S. crypto legislation after a White House meeting between the administration and industry executives. Price has since cooled into a range between $77,500 and $79,500. Momentum indicators show the uptrend intact but losing force, setting up a break in either direction.
Compression at the Edge
Bitcoin’s five-hour chart shows price wedged just under $79,000, caught between a bullish structural bias and clear signs of fading momentum. The SuperTrend indicator remains bullish at $75,918, while the 200-day simple moving average sits far below at $66,239 — a gap of roughly 19%. That extension puts the rally well ahead of its long-term trend line.
Momentum readings are split. The ADX, a measure of trend strength, holds at 58.91, showing the uptrend still carries force. But the MACD histogram has turned negative and the RSI is pulling back from overbought levels, both signaling that buying pressure is weakening even as the trend itself holds.
- Bulls need volume plus a fresh RSI push above $81,220, the recent high, to confirm a break out of the range.
- Bears are watching for a five-hour close below the SMA(20) or the SuperTrend line to trigger a deeper pullback.
Support, Resistance, and the ATH Gap
The $77,500–$79,500 band has turned into a chop zone: price compresses, volume thins, and neither side commits. A cluster of doji candles — sessions where open and close prices land almost level — shows that hesitation directly on the chart. Volume has declined through the flag formation, a pattern that often precedes a sharper move once it breaks.
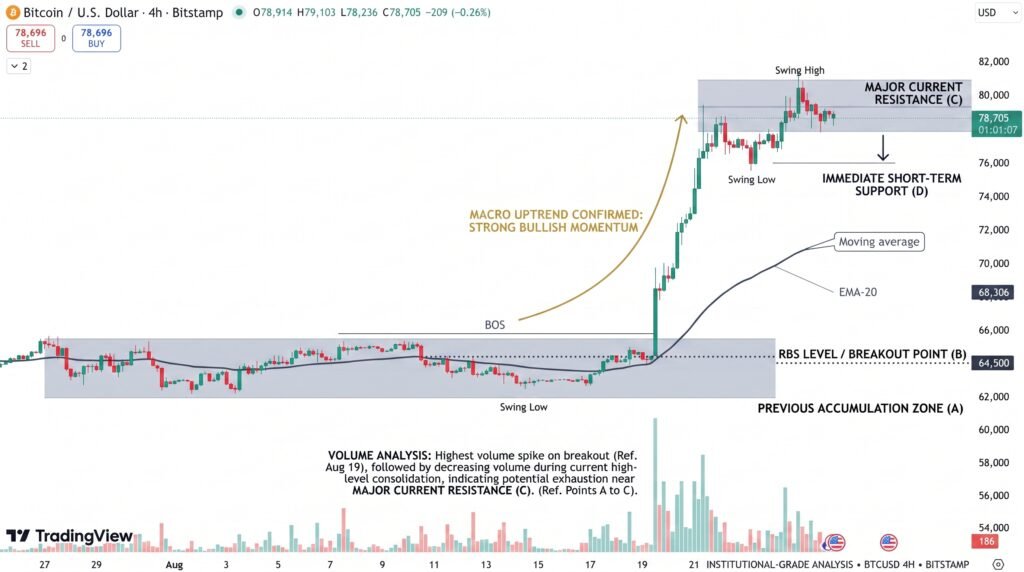
Support sits at $75,918, where the SuperTrend line runs, and again near $76,000, a former resistance level that flipped to support during the rally. Resistance clusters at $81,220 and $81,300. Below the range, the 50-day moving average at $72,164 and the 200-day average at $66,239 stand as mean-reversion targets if the trend fails. For context, Bitcoin’s all-time high remains $126,272, set on October 6, 2025 — the current price sits roughly 37% below that peak, and the coin’s market capitalization stands near $1.33 trillion, well above Ethereum’s roughly $233 billion.
Conclusion: What the Setup Means for Traders
Entries made this far into an extended rally carry real risk. When price stretches nearly a fifth above its long-term average, sharp volatility, failed breakouts, and sudden reversals become more likely. Bitcoin’s current position near $79,000 fits that description: a strong trend, but stretched positioning.
Traders seeking exposure to a breakout should size positions conservatively and set stop-losses near the $75,918 support level. Traders who prefer to avoid the risk of a false move should wait for a confirmed close outside the $77,500–$79,500 range, since the eventual resolution — up toward $81,220 or down toward the moving averages — is likely to move fast once it starts.
Sources & Methodology
Primary-source standard: Market-moving facts should link to original data releases, regulator notices, company filings or official project announcements whenever available. Secondary reporting is used for additional context, not as a substitute for original evidence.
Page last reviewed: