
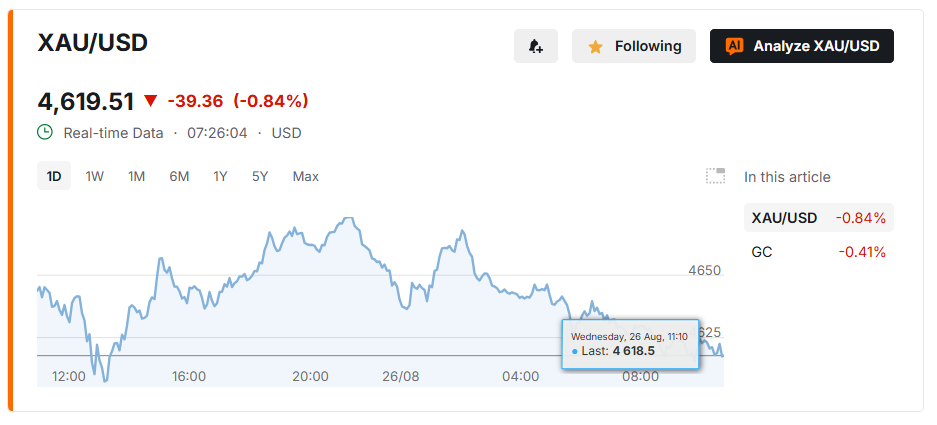
Gold has pulled back to $4,692.06 after tapping a near-term high of $4,755, with the five-hour chart caught between strong bullish momentum and early signs of exhaustion. The metal’s advance this month has been driven by expectations that the Federal Reserve will cut rates, ongoing Middle East tensions, and the U.S. Treasury’s decision to double its long-term bond buyback program. Gold remains near its highest level in three months, though a bull flag pattern and a fresh MACD warning suggest the next move could break sharply in either direction.
Trend Power Meets a Warning Sign
Price still sits above both the SuperTrend line at $4,594.22 and the 50-period simple moving average at $4,541.52, keeping buyers structurally in control. The ADX reads 46.79, confirming the trend still carries real force.
Underneath that strength, momentum is fading. The MACD has posted a bearish cross, with the signal line at 49.64 below the MACD line at 56.68, and the RSI has eased to 60.90 from overbought territory. A doji candle at the current price shows the open and close landing almost level — a sign neither buyers nor sellers currently have control. A five-hour close below the 20-period SMA would raise the odds of a faster pullback.
- The bullish case rests on a breakout above VWAP, or a controlled pullback that holds above trend support.
- The bearish case targets a rejection at resistance or a break of support, though shorting against an active uptrend carries higher risk.
The Chop Zone Traders Are Watching
Volume has thinned and the doji reflects that hesitation directly. The $4,650–$4,720 range has become a chop zone where whipsaws are common and neither side has confirmation. A close above resistance or below support is needed before the next move gets clearer direction.
The bull flag pattern remains intact, but a bearish RSI divergence — price making a higher high while RSI fails to confirm it — adds caution to the bullish case. A five-hour close below the SuperTrend at $4,594 opens the door to the 38.2% Fibonacci level at $4,575, with deeper mean reversion possible below that.
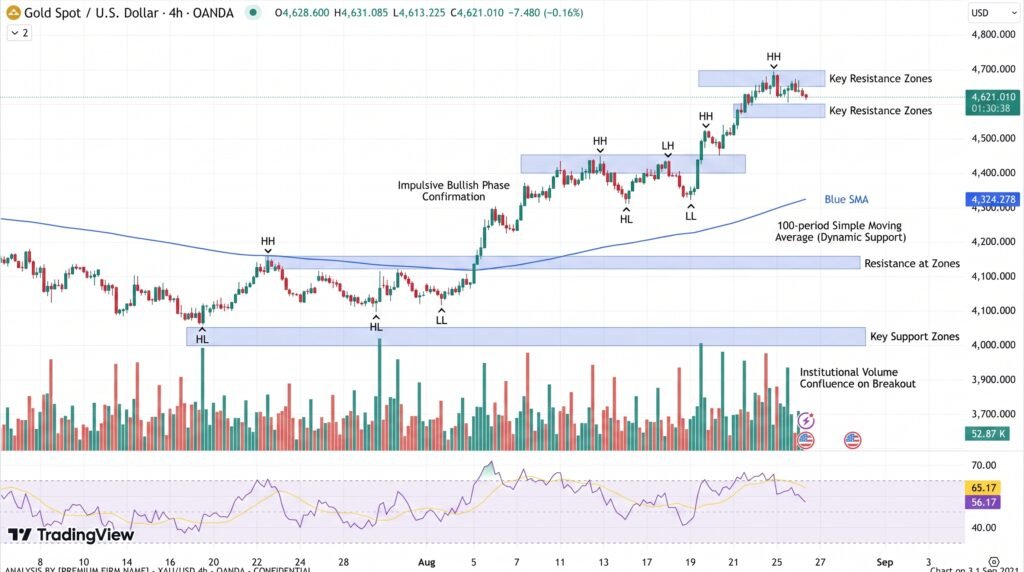
- Support: $4,570–$4,600 (SuperTrend and Fibonacci confluence)
- Resistance: $4,755 (recent high, also a bull-trap zone)
Mean Reversion Risk After the Rally
Gold’s rally has been sharp enough to pull the metal within range of its 2026 record of $5,597.23, set on January 29. That context matters: parabolic moves draw in new buyers fast, but once momentum cools, price tends to snap back toward the moving averages that anchored the move higher. Here, the 20- and 50-period SMAs mark the line between a healthy continuation and a deeper unwind.
Traders holding long positions should watch the $4,594 SuperTrend level closely — a clean break below it shifts the near-term bias toward $4,575 and lower. Those looking for a bearish entry should wait for confirmation outside the $4,650–$4,720 range rather than trading the chop directly, since a premature short against an ADX above 46 carries real risk of a fast reversal back toward $4,755.
Sources & Methodology
Primary-source standard: Market-moving facts should link to original data releases, regulator notices, company filings or official project announcements whenever available. Secondary reporting is used for additional context, not as a substitute for original evidence.
Page last reviewed: