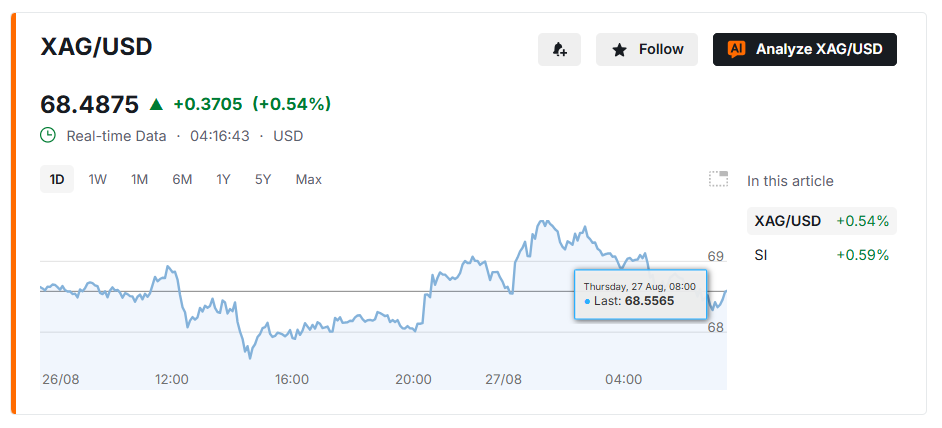
Silver is trading at $68.44, caught between fading short-term momentum and firm medium-term support on the five-hour chart. The metal has climbed roughly 17% this month, driven by industrial demand from solar, electric-vehicle, and data-center manufacturing, alongside expectations for Federal Reserve policy easing. A doji candle at $68.55 shows real indecision at current levels, and a sustained close below $67.60 could open the door to a sharper decline toward $66.14.
Tension in the Trading Range
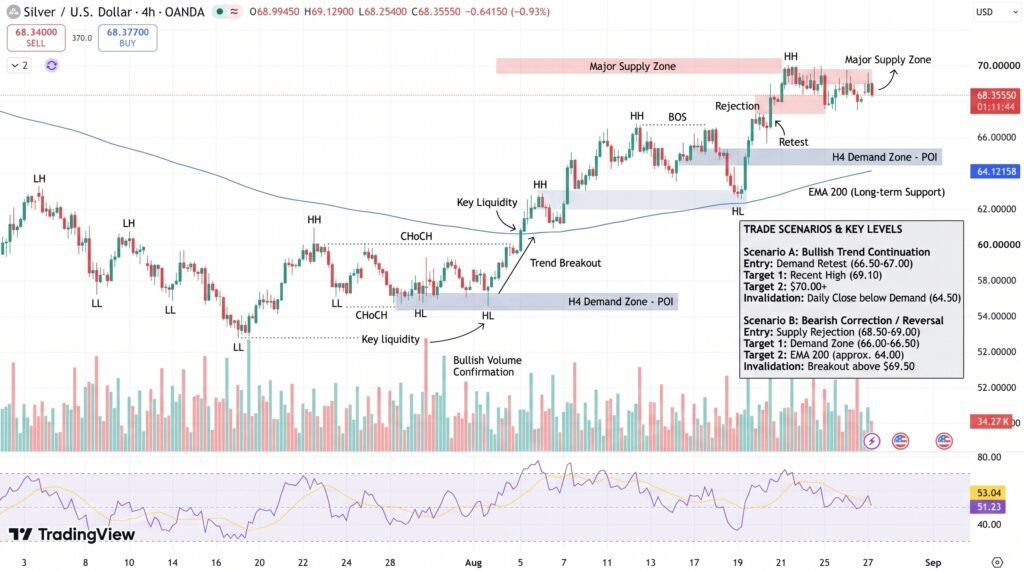
Silver is sending conflicting signals across timeframes. The medium-term uptrend remains intact above the 50-period SMA at $66.97, but short-term control has shifted to sellers after price slipped below the 20-period SMA at $68.69. That shift, combined with a doji candle forming at $68.55, points to genuine indecision rather than a clear directional move.
- Current price: $68.44, with the candle still forming and not yet closed
- Range: active consolidation between $67.50 and $70.00
- Danger zone: a sustained close below $67.60 risks an accelerated move to $66.14
Key Risks and No-Go Zones
The clearest risk sits just above current price. A breakout above $69.00 that fails to hold could trap buyers who entered late, particularly since the $68.50–$69.50 band carries the heaviest trading volume on the chart — a zone likely to produce sharp reactions in either direction once it resolves. Structural support lies at $66.14, where the SuperTrend indicator and a key Fibonacci level converge, and again at the $66.97 SMA(50). A failure of either level would likely accelerate any decline.
The $67.60–$69.00 band itself qualifies as a no-trade zone: support and resistance overlap there closely enough that positions opened inside it are prone to getting stopped out on noise rather than genuine direction. Behind the price action, a negative MACD cross confirms sellers currently hold short-term momentum, while the Money Flow Index at 16.75 sits close to oversold — a sign recent selling pressure may be nearing exhaustion even as the broader signal stays bearish.
Range Rules Until It Breaks
Silver’s setup rewards patience over prediction right now. With resistance and support layered so closely together between $67.60 and $69.00, chasing moves inside that band mostly produces losses to slippage and whipsaws rather than clean trend trades. The metal needs a decisive close above $69.00 or below $67.60 to establish real direction.
Traders should treat $66.14 and $66.97 as the levels that matter most on the downside, since a break of either would shift the broader structure from consolidation to a deeper pullback. On the upside, a genuine breakout needs to clear the $68.50–$69.50 volume cluster with conviction, not just a brief spike above $69.00. Until one of those levels gives way, the range — not the headlines — is what’s setting silver’s price.on here.
Sources & Methodology
Primary-source standard: Market-moving facts should link to original data releases, regulator notices, company filings or official project announcements whenever available. Secondary reporting is used for additional context, not as a substitute for original evidence.
Page last reviewed: