
Gold has retreated from an intraday peak of $4,751 to $4,651.04, forming a bearish engulfing candlestick on the 5-hour chart that trapped late buyers. The pullback comes as the metal sits roughly 15% higher this month and near its highest level since mid-May, with traders now weighing Federal Reserve policy signals from Jackson Hole against fading short-term momentum. A break of either $4,690 resistance or $4,630 support will likely decide the next directional leg.
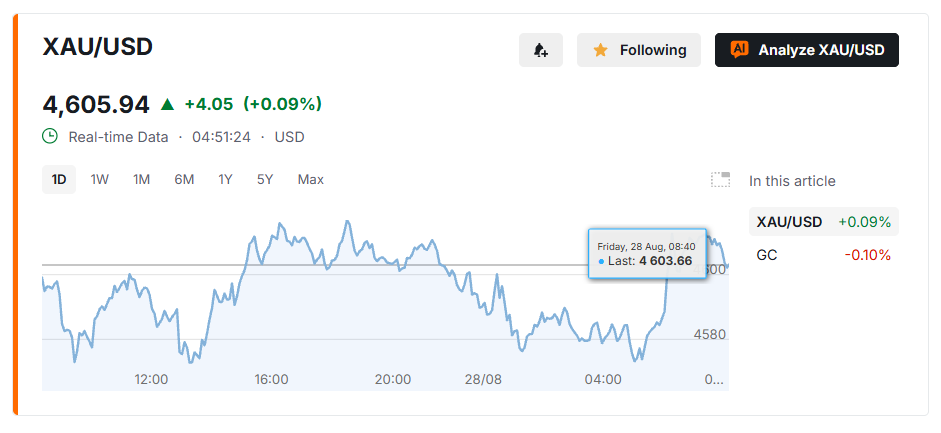
Momentum Turns Against Bulls
The technical damage is measurable. MACD has crossed bearish, with the indicator line at 16.73 against a signal line of 28.25, confirming that upside thrust is fading. Price has also slipped below its 20-period simple moving average, a level that had supported the climb from June’s low near $3,942.43. The Relative Strength Index has cooled to 53.41 after brushing overbought territory earlier this week, when spot gold touched $4,703. Average True Range readings near 38.27 point to roughly 0.8% swings per bar, meaning volatility remains elevated even as momentum stalls.
- MACD bearish crossover: 16.73 versus signal 28.25
- Price below the 20-period SMA
- RSI down to 53.41 from overbought
Key Support and Resistance Zones
Resistance clusters between $4,690 and $4,730, a zone where a rebound lacking fresh volume would likely trap buyers a second time. Support consolidates between $4,560 and $4,590, where the 50-period SMA, the Ichimoku Cloud top, and the SuperTrend indicator converge — a break below this band would validate a double top pattern that is roughly halfway to confirmation. Bearish divergence, where price posted a higher high while MACD and RSI printed lower highs, reinforces the case for caution. A close below $4,630 would confirm the current consolidation has failed, opening a path toward $4,580 and an estimated 2.75:1 risk-to-reward ratio for short positions. Long setups need a volume-backed close above $4,700 to regain credibility.
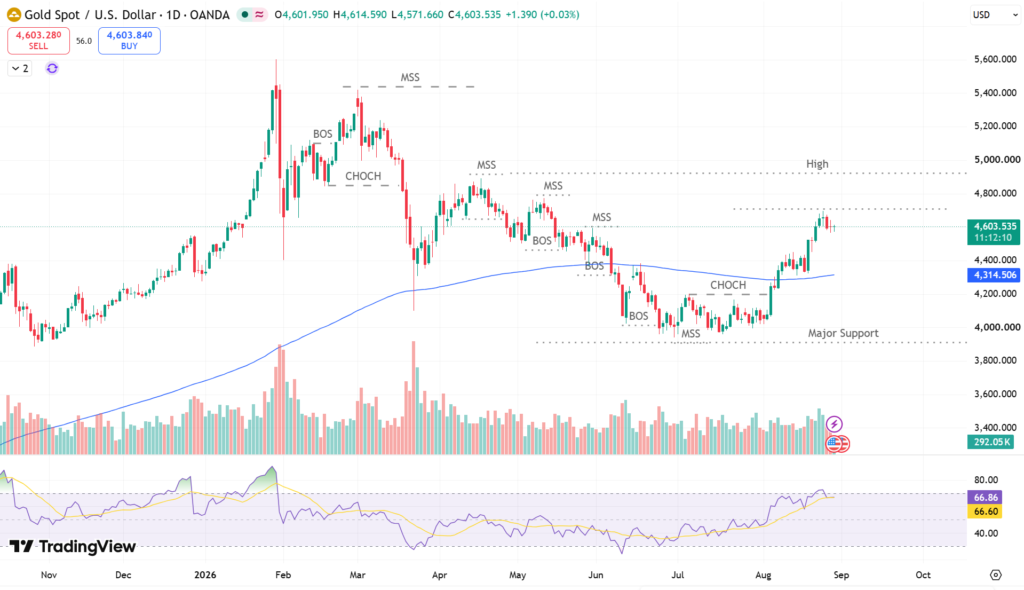
Broader context matters here. Gold’s 2026 rally has been driven by concerns over dollar debasement following the U.S. Treasury’s bond-buyback decisions, sticky inflation data, and anticipation around Fed Chair Kevin Warsh’s Jackson Hole remarks. The metal’s record high this year stands at $5,597.23, set on January 29, underscoring how far current levels sit below the year’s extreme even after this month’s advance.
Conclusion: What Traders Should Watch
Gold’s drop from $4,751 fits a recognizable pattern: extended highs, momentum divergence, and a bearish reversal candle often precede deeper pullbacks. The next few sessions hinge on two levels — rejection near $4,690–$4,730 favors sellers targeting $4,580, while a volume-confirmed break above $4,700 would undercut the bearish case entirely. An expanding MACD histogram to the downside and a pickup in down-volume would be the clearest signs that sellers have taken control.
Sources & Methodology
Primary-source standard: Market-moving facts should link to original data releases, regulator notices, company filings or official project announcements whenever available. Secondary reporting is used for additional context, not as a substitute for original evidence.
Page last reviewed: