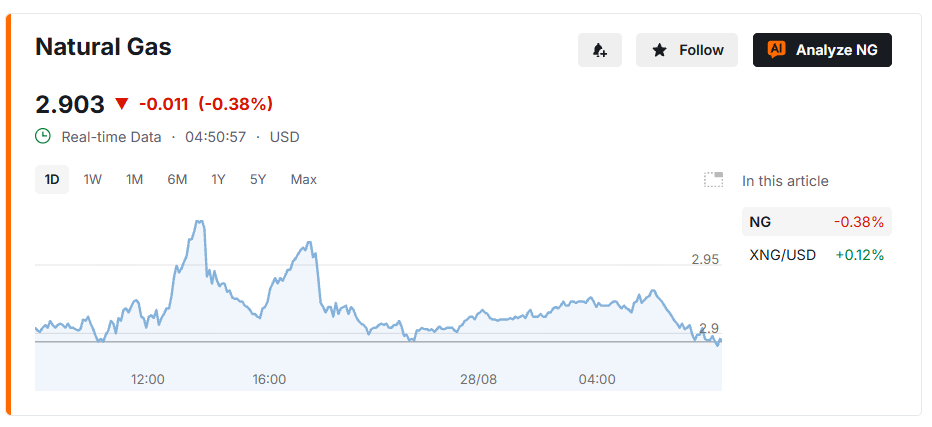
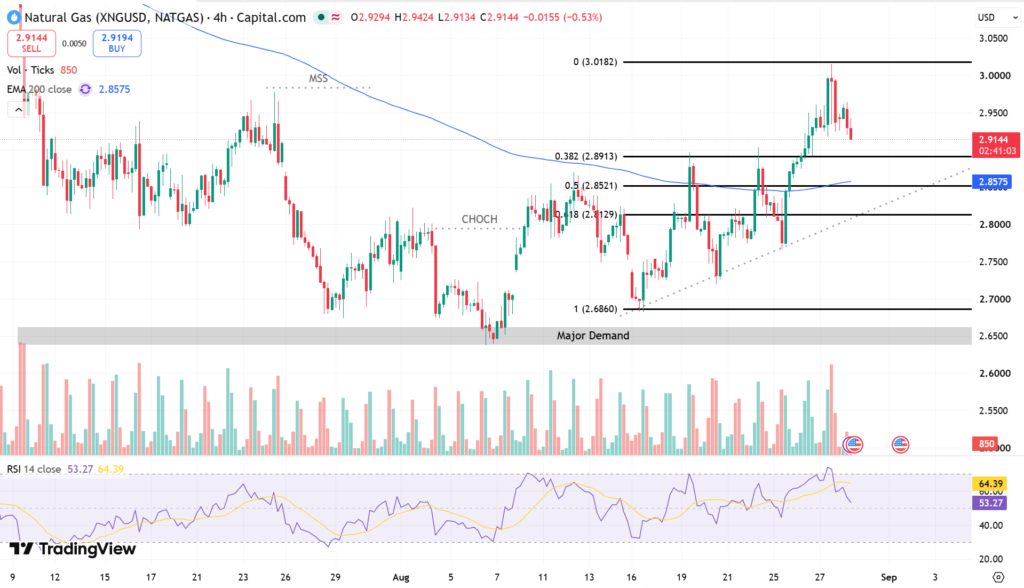
Natural Gas is trading near $2.91, its highest level in roughly a month, after forecasts for extended hot weather across the eastern two-thirds of the U.S. lifted cooling-demand expectations. Price has completed a V-shaped recovery from $2.616, reclaiming the 200-period simple moving average at $2.857 with an ADX reading of 37.59 confirming real trend strength. Yet a sharp rejection at $2.989, marked by a long upper wick, shows sellers are actively defending the $2.99 zone.
A Confirmed Uptrend Meets Resistance
Momentum indicators support the bullish structure. ADX above 37 signals a strong, established trend rather than a weak drift, and MACD remains in bullish territory. But the rejection at $2.989 matters: it’s a textbook sign of supply entering exactly where the 50% Fibonacci retracement and recent local high converge. Record U.S. production is adding friction to the rally — Lower-48 output has averaged 111.4 billion cubic feet per day this month, up from 110.7 bcfd in July, while inventories sit 6.7% above the five-year seasonal average. That supply cushion helps explain why buyers have struggled to clear $2.99 outright despite strong demand signals.
The No-Man’s-Land Between $2.86 and $2.95
Support now holds firm between $2.81 and $2.86, anchored by the 200-SMA and the SuperTrend indicator, while resistance caps gains near $2.99. Between those bands sits a chop zone — $2.86 to $2.95 — where price is likely to trade sideways until a catalyst forces a decision. The RSI at 62.9 is approaching overbought, raising the odds of a mean-reversion pullback even within an intact uptrend. Separately, LNG exports through the Strait of Hormuz have fallen roughly 95% since military operations against Iran began in late February, removing close to a fifth of global LNG supply — a structural factor that keeps volatility elevated regardless of near-term technical levels.
- Support: $2.81–$2.86 (200-SMA, SuperTrend)
- Resistance: $2.99 (local high, 50% Fibonacci)
- No-trade zone: $2.86–$2.95
For bullish setups, an aggressive entry near a $2.86 retest targets $2.99 first, then $3.10 and $3.20, with a stop below $2.79 offering up to a 4.85 risk-to-reward ratio. Bearish setups look for a lower high near $2.95 or a confirmed close below $2.85, targeting $2.81, $2.75, and $2.62, with a stop above $3.01 and risk-to-reward as high as 5.50 on the deepest target. The EIA’s own forecast puts Henry Hub prices averaging $2.87 in the third quarter, suggesting current levels already price in much of the near-term demand story.
Conclusion: A Tight Range Points to a Bigger Move
Natural gas sits at a genuine inflection point. The V-shaped recovery is roughly 80% complete, and the tight range between $2.86 and $2.99 rarely persists for long once volume returns. Weather forecasts, the weekly EIA storage report, and record production levels are the immediate catalysts to watch. Traders are better served waiting for a decisive close above $2.99 or below $2.81 than guessing inside the current squeeze, where whipsaws are the most likely outcome until one side takes control.
Sources & Methodology
Primary-source standard: Market-moving facts should link to original data releases, regulator notices, company filings or official project announcements whenever available. Secondary reporting is used for additional context, not as a substitute for original evidence.
Page last reviewed: