
Solana is trying to turn the $100 area from resistance into support after a sharp recovery from its summer lows, improving the short-term technical picture. Two daily charts now put the focus on whether SOL can hold that breakout and clear $110.15, a move that could open a broader advance toward the $130 to $150 region, though the larger structure remains unconfirmed.
SOL Faces Major Fibonacci Resistance
Solana’s rebound from its June low has restored a local uptrend, but the first chart treats the advance as corrective and places SOL beneath a broad Fibonacci resistance zone beginning at $110.15. The daily chart shows SOL recovering from roughly the low-$60 area and accelerating toward $100 before consolidating. That rebound has improved momentum, but the token has yet to break the first major retracement level needed to strengthen the case for a sustained recovery.
The chart marks $110.15 as the 38.2% Fibonacci retracement and the first key resistance level. A confirmed daily close above it could shift attention toward $132.93, the 50% retracement, followed by $160.42 at the 61.8% level. The broader resistance zone extends as high as $209.63. These levels matter because the Elliott Wave interpretation still classifies the rise from the June low as corrective, meaning SOL can keep climbing without yet proving the larger bearish structure has ended.
Key levels defining the setup:
- $110.15: 38.2% Fibonacci retracement, the first confirmation point
- $132.93: 50% retracement, the next visible target if $110.15 breaks
- $62.43-$43.22: lower support zone defining downside risk
Former Resistance Near $100 Faces a Retest
A second daily chart offers a more straightforward bullish setup: Solana has pushed through resistance around $100 and is now attempting to establish that level as support. The $100 region has acted as a major pivot across several prior periods, making the latest breakout technically significant. The central question is whether buyers can defend it on a retest.
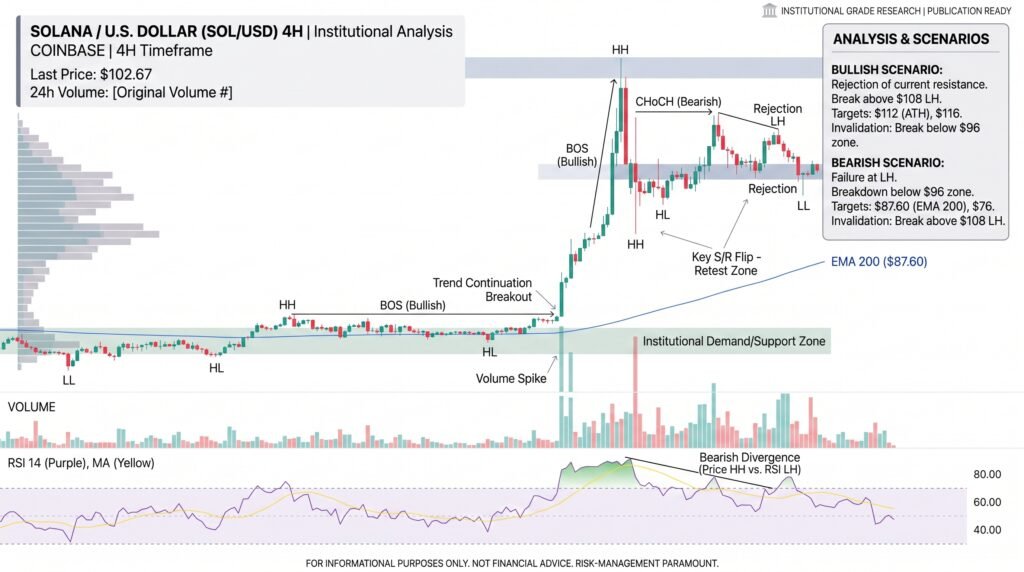
If former resistance holds as support, the chart’s projected path points toward a larger supply zone around $148 to $152, which previously acted as resistance and represents the next major structural hurdle. The bullish scenario doesn’t require SOL to move directly toward $150; the first step is maintaining acceptance above $100, and the next is clearing resistance near $110, which aligns closely with the Fibonacci threshold from the first chart. If SOL falls back below the reclaimed zone and cannot recover it, the breakout thesis weakens, with another major support area near $66 as the next reference point.
Conclusion: A Conditional Setup
Together, the two charts present a clearly defined but conditional Solana price prediction. SOL has improved its technical position by reclaiming $100, but confirmation still depends on holding that support and breaking $110.15. If both conditions are met, $132.93 becomes the next visible Fibonacci objective, with the roughly $150 resistance zone standing as the larger upside test.
Sources & Methodology
Primary-source standard: Market-moving facts should link to original data releases, regulator notices, company filings or official project announcements whenever available. Secondary reporting is used for additional context, not as a substitute for original evidence.
Page last reviewed: