
Bitcoin’s 200-week moving average (200W MA) has historically provided one of the clearest measures of the cryptocurrency’s structural long-term trend. It tracks Bitcoin’s average weekly closing price over roughly four years, smoothing short-term volatility and capturing much of the asset’s broader bull-and-bear cycle.
The indicator is particularly notable because its long-term trend has only moved higher throughout Bitcoin’s history. Even severe BTC drawdowns have not been long enough to reverse the four-year average. That behavior is the foundation of the “Bitcoin only goes up” idea.
This does not mean Bitcoin price can only rise. BTC has experienced several drawdowns of more than 50%. Instead, the phrase refers specifically to the long-term direction of the 200W MA.
Traditional assets have behaved differently. The S&P 500’s 200-week moving average has flattened or declined during prolonged periods of weak returns, while gold has also experienced extended periods in which its long-term moving average lost momentum.
That makes Bitcoin’s 200W MA an unusual long-term trend indicator and an important reference point for BTC technical analysis.
The 200W MA sets the floor
Bitcoin has historically spent very little time below its 200W MA. Galaxy Research found that BTC had closed below the indicator on only 56 of 642 weekly closes, highlighting how unusual sustained breaks beneath the average have been.
The level has also repeatedly coincided with major Bitcoin bear market bottoms. The 2015 and 2018 cycle lows formed close to the 200W MA, while Bitcoin briefly tested the area during the March 2020 crash.
The 2022 bear market provided the major exception. Bitcoin broke below the 200W MA and remained beneath it for an extended period as the crypto market went through widespread deleveraging and the FTX collapse. The eventual cycle low formed below the moving average before BTC later reclaimed it.
The current cycle has again tested the long-term indicator. Bitcoin moved around the 200W MA during the June 2026 sell-off, reinforcing its importance as a potential cycle-floor reference. However, historical evidence shows that touching or reclaiming the level alone does not prove a bear market has ended.
The key lessons are:
- 200W MA: Long-term cycle-floor reference.
- Price near 200W MA: Historically associated with major bottoming phases.
- Break below 200W MA: Possible during severe bear markets.
- Reclaim: Constructive, but not sufficient to confirm a new bull market.
That is where the faster 50W MA becomes important.
The 50W MA confirms the transition
The 50-week moving average (50W MA) tracks roughly one year of weekly price action, making it more responsive to changes in Bitcoin’s momentum than the 200W MA.
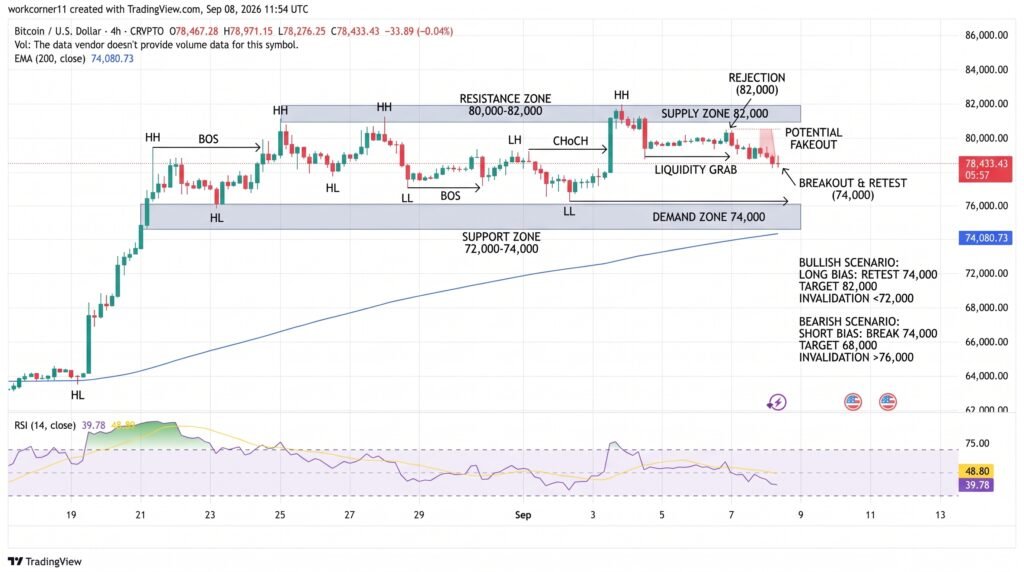
During major bear markets, the 50W MA often becomes a ceiling. Bitcoin may rally toward it several times without producing a sustained weekly close above the indicator. That makes the level particularly useful for determining whether a bottoming phase is turning into a broader trend reversal.
Galaxy Research found that in four of five completed Bitcoin bear markets, the first sustained break above the 50W MA correctly confirmed that the bear market was over. The major exception was the 2021–22 cycle, when Bitcoin reclaimed the average twice before eventually making a lower low.
This makes a decisive weekly reclaim more important than a temporary intraday move. If Bitcoin closes above the 50W MA and subsequently holds it as support, the probability that the cycle low has already formed would increase substantially.
The framework is therefore straightforward:
- 200W MA holds: Long-term downside structure remains supported.
- Bitcoin recovers: Evidence of a potential cycle bottom strengthens.
- 50W MA reclaimed: Bear-market transition gains confirmation.
- 50W MA becomes support: The case for a new Bitcoin bull market strengthens.
The trade-off is timing. The 50W MA is a confirmation signal rather than an early bottom indicator. Waiting for confirmation can mean entering after Bitcoin has already recovered significantly from its absolute low, but it also reduces the risk of treating a temporary bounce as a completed cycle transition.
Conclusion
Bitcoin’s 200W and 50W moving averages provide two complementary signals for analyzing the current Bitcoin cycle. The 200W MA has historically acted as the long-term floor, while the 50W MA has offered stronger confirmation that a bear market has actually ended. The latest recovery from the 200W area is constructive, but history shows that a decisive weekly reclaim of the 50W MA would provide a much stronger signal that the cycle has transitioned into a new bull phase. Until that confirmation is secured, Bitcoin remains in a cycle-transition stage rather than a fully confirmed new bull market.
Sources & Methodology
Primary-source standard: Market-moving facts should link to original data releases, regulator notices, company filings or official project announcements whenever available. Secondary reporting is used for additional context, not as a substitute for original evidence.
Page last reviewed: