Silver is showing limited directional momentum after briefly attempting to break higher from its recent consolidation range. On the five-hour chart, XAG/USD was trading around $68.02, placing the metal near the middle of a range bounded by roughly $67.10 and $69.50.
The setup leaves traders exposed to false breakouts. Price remains inside the broader $67.50-$69.00 congestion area, where short-term moves can reverse quickly without confirmation from volume or trend indicators.
The latest price action also points to declining momentum. Silver slipped about $0.50 from the session high before returning toward $68, keeping the market in a narrow band rather than establishing a sustained directional move.
Momentum Signals Remain Weak
The moving averages provide a relatively stable technical base. The 20-period simple moving average sits near $67.10, while the 50-period SMA is around $67.08. Their proximity indicates that the short- and medium-term trend remains compressed.
The SuperTrend indicator is still bullish near $68.15, but that signal has limited weight while the broader market lacks strong directional momentum. The five-hour ADX reading of 18.65 is particularly important because readings below 20 generally indicate a weak trend environment.
The technical picture is therefore better defined by levels than by a strong trend:
- First support: $67.00-$67.20
- First resistance: $68.55
- Major resistance: $69.50
- Bullish invalidation: Below $67.00
- Bearish invalidation: Above $69.60
The upper Bollinger Band near $68.55 represents the first technical hurdle for buyers. A move through that level would need follow-through to challenge the $69.50 range ceiling.
Breakout Needs Volume Confirmation
Volume is becoming increasingly important as the consolidation matures. Falling activity during a sideways market reduces the reliability of isolated moves beyond support or resistance. A brief move above $68.55, for example, would not necessarily establish a bullish breakout without stronger participation.
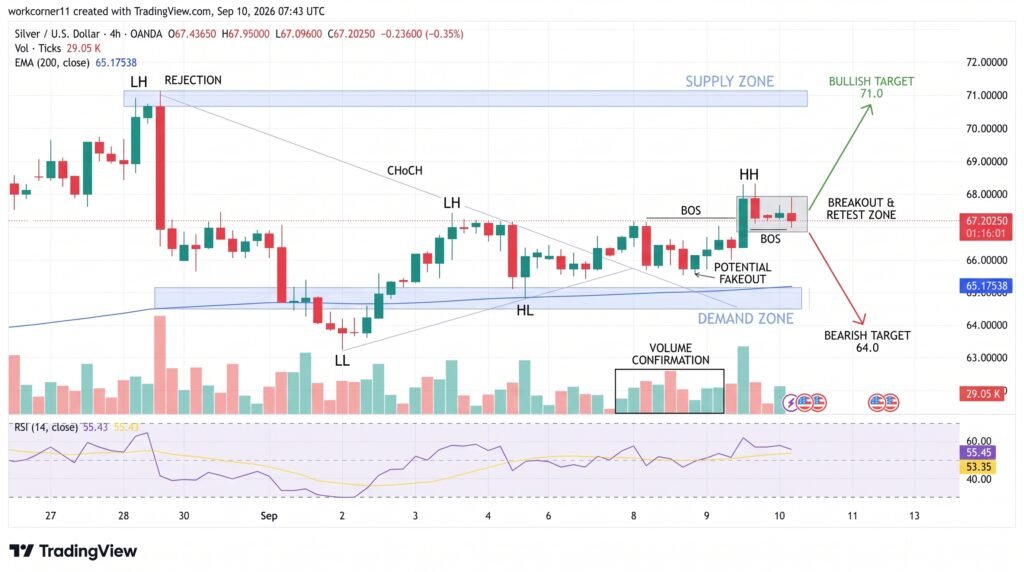
The ATR stands near $0.96, or about 1.4%, highlighting relatively contained price movement compared with a stronger trending environment. A sustained increase in volatility could therefore signal that the compression phase is ending.
The $68.15 area also remains significant because the latest doji formation reflects indecision between buyers and sellers. Traders looking for a directional move may therefore want confirmation rather than reacting to a single intraday spike.
Conclusion:
Silver remains trapped near $68, with $67.00-$67.20 providing the key downside area and $68.55-$69.50 defining the main upside barriers. The technical structure favors patience while XAG/USD remains inside the consolidation zone. A decisive break supported by stronger volume and rising ADX would provide a more credible signal than a brief move beyond either boundary. Until then, the risk of a false breakout remains elevated.
Sources & Methodology
Primary-source standard: Market-moving facts should link to original data releases, regulator notices, company filings or official project announcements whenever available. Secondary reporting is used for additional context, not as a substitute for original evidence.
Page last reviewed: