Japan’s Nikkei 225 rebounded toward 65,650 on Wednesday after closing the previous session at 65,269.33, but the index remains below an important technical resistance zone. The supplied five-hour chart places resistance around 65,400-65,800, where several moving averages and the Ichimoku structure converge. The recovery follows Tuesday’s 1.70% decline as a stronger yen and expectations for another Bank of Japan rate increase pressured Japanese equities. For the short-term technical outlook, 65,800 remains the main upside barrier while the 64,000 region provides important downside support.
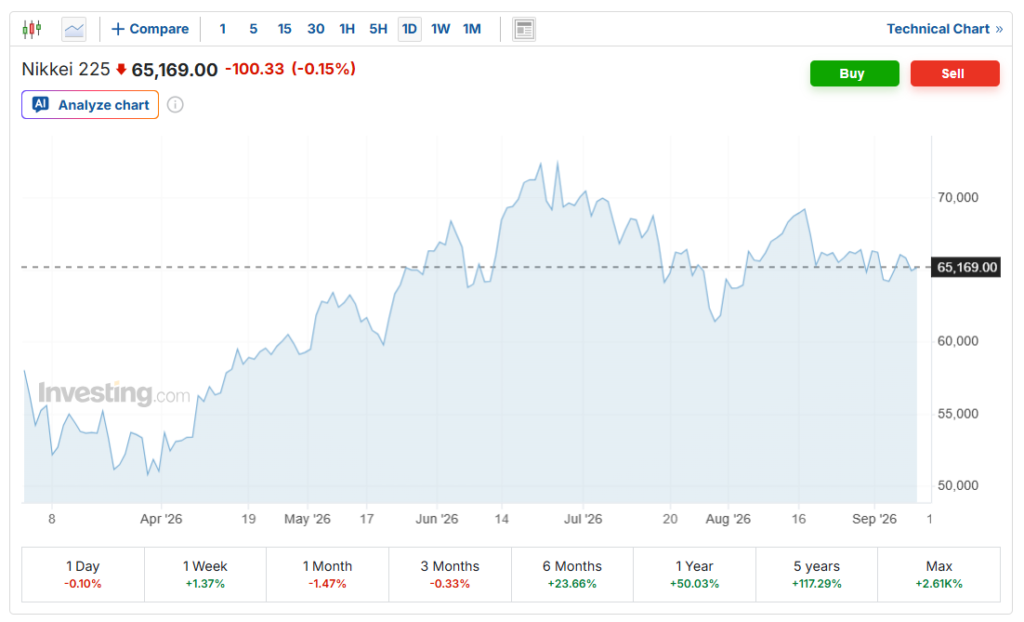
Nikkei Recovers After 1.7% Drop
Official Nikkei 225 data shows the index closed at 65,269.33 on September 8, losing 1,130.51 points, or 1.70%. The session was volatile, with the benchmark reaching 66,791.84 before finishing at its daily low. On September 9, the index recovered to approximately 65,657, up about 0.6% in morning trading.
The pullback followed a strong September 7 session, when the Nikkei jumped 2.12% to 66,399.84, supported partly by semiconductor and AI-related stocks. That rally quickly encountered pressure as the Japanese yen strengthened.
The yen recently reached its strongest level against the U.S. dollar since February as markets increased expectations for another Bank of Japan rate increase. A stronger yen can pressure Japanese exporters because overseas earnings translate into fewer yen, making currency movements particularly important for the Nikkei. Japan’s upgraded second-quarter GDP figures and stronger real wage growth have added to expectations that the BOJ could tighten policy again.
65,800 Remains the Main Barrier
On the supplied five-hour technical setup, the Nikkei remains around an important 50% Fibonacci retracement area while facing a cluster of the 20-, 50- and 200-period simple moving averages together with Ichimoku resistance.
That makes 65,400-65,800 the immediate technical zone to watch. A sustained five-hour close above 65,800 would weaken the current bearish setup and indicate that buyers are regaining control after Tuesday’s decline.
Momentum remains less convincing below that level. The supplied chart shows MACD remaining negative, while the recent doji formation around 65,077 reflects indecision rather than providing a directional signal by itself.
On the downside, 64,000 remains the key technical support area. A confirmed five-hour close below that region would weaken the recovery and bring 62,500 back into focus as the next major structural support.
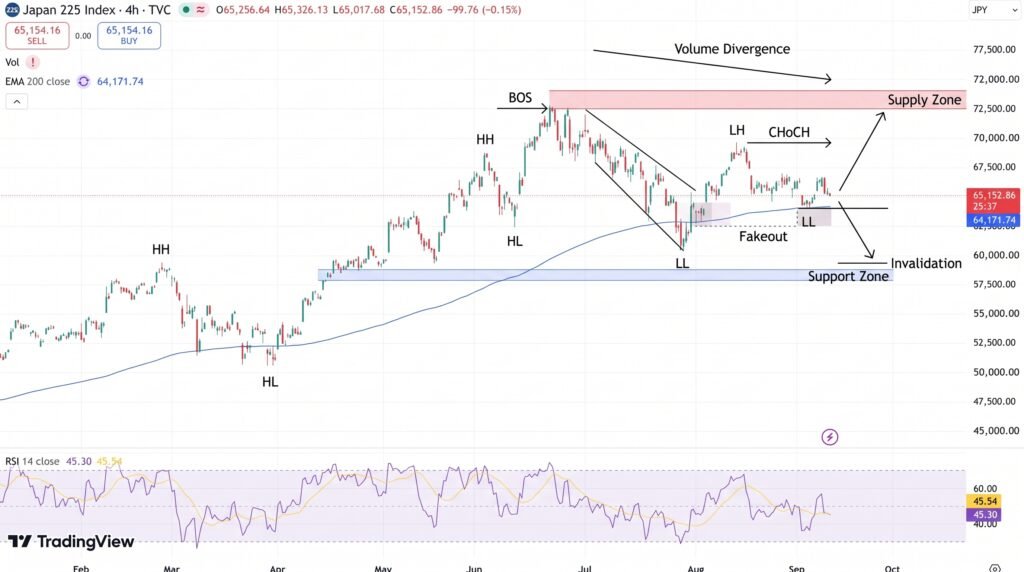
Volatility also remains elevated. The chart’s Average True Range near 614 points indicates that relatively large intraday swings remain possible, making confirmation around support and resistance more important than isolated price touches.
Conclusion
The Nikkei 225 has recovered toward 65,650 after Tuesday’s 1.70% decline, but the five-hour technical structure has not yet produced a clear bullish breakout. The 65,400-65,800 resistance cluster remains the immediate test, while 64,000 is the main downside level.
Macro conditions add another layer of uncertainty. A strengthening yen, expectations for further BOJ tightening and Brent crude approaching $100 are all relevant risks for Japanese equities. Until the Nikkei establishes a sustained move above 65,800 or below 64,000, the index remains caught between technical resistance and established support.
Sources & Methodology
Primary-source standard: Market-moving facts should link to original data releases, regulator notices, company filings or official project announcements whenever available. Secondary reporting is used for additional context, not as a substitute for original evidence.
Page last reviewed: