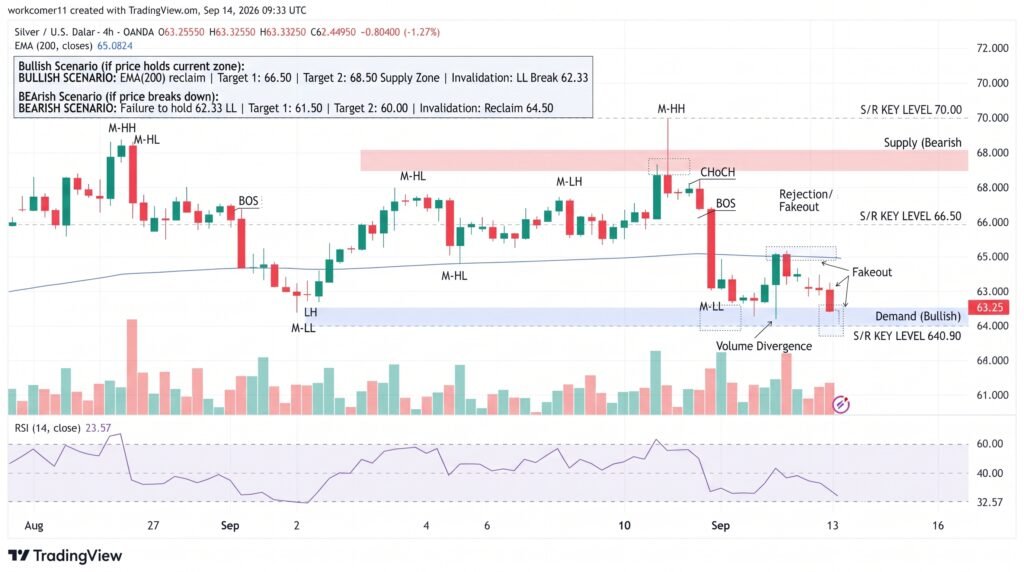
Silver is testing an important technical support zone after a sharp decline pushed XAG/USD to $64.08 on the five-hour chart. The 200-period simple moving average (SMA) at $63.86 is now the key line separating a potential rebound from a deeper correction. A sustained break below that level would expose the next major support near $63.08, while a successful defense could encourage buyers to challenge nearby resistance.
The broader precious-metals market is facing a stronger policy headwind. Reuters reported Monday that silver fell 1.9%, as traders raised expectations for a Federal Reserve rate increase following firmer U.S. inflation data and a sharp rise in oil prices.
200 SMA Becomes the Key Test
The $63.86 200-period SMA is the immediate technical battleground. This widely followed average is often used to identify the broader direction of a market. Holding above it would keep the possibility of a technical rebound alive, while a decisive five-hour close beneath it would strengthen the bearish setup.
Shorter-term averages reinforce the pressure. Silver remains below its 20-period SMA at $65.87 and 50-period SMA at $66.24, showing that sellers still control the near-term trend. The MACD also remains negative, with the histogram at -0.69 against a signal reading of -0.52.
At the same time, the Relative Strength Index (RSI) has fallen to 38.52. That is not technically oversold, but it shows that momentum has weakened considerably.
The chart also contains a developing double-top pattern around $71.16. The pattern is not confirmed until support breaks, but its presence increases the importance of the $63–$64 region.
Fed Pressure Adds to Silver Risks
Silver is particularly sensitive to changes in interest-rate expectations because it is a non-yielding asset. A higher expected policy rate can lift Treasury yields and the dollar, increasing the opportunity cost of holding precious metals.
The latest U.S. inflation data have strengthened that pressure. August headline CPI rose 0.4% month over month and 3.4% year over year, while core CPI increased 0.3% monthly. Goldman Sachs and JPMorgan now expect a 25-basis-point Fed hike at the September meeting, with market pricing around 87%.
At the same time, oil prices above $100 are adding to inflation concerns. WTI recently climbed to about $102.94, while Brent approached $107.81, as Middle East disruptions threatened energy supply routes.
For silver, the immediate market risks are:
- Stronger U.S. rate expectations and Treasury yields.
- A firmer dollar ahead of the Fed decision.
- Persistent geopolitical support for commodity volatility.
Silver Levels Define the Next Move
The technical map is relatively clear. Bulls need the $63.08–$63.86 zone to hold, preferably alongside stronger buying volume. A rebound from that area could first target $65.50, followed by the 20-period SMA at $65.87 and the 50-period SMA at $66.24.
The upper end of that range is important because a sustained recovery through the short-term averages would weaken the immediate bearish structure. A stronger move above $66.24 could shift attention toward the upper part of the recent range.
For bears, confirmation comes from a five-hour close below $63.86. Such a breakdown would put $63.08 in focus, followed by the prior support areas near $61.17, $58.00 and $55.00.
The Average True Range (ATR) near 1.04, equivalent to roughly 1.62%, indicates that daily price swings remain substantial. That makes false breaks around the 200 SMA particularly important to watch.
Conclusion
Silver is approaching a decisive technical point at $63.86, where the 200-period SMA could determine whether the current correction stabilizes or accelerates. Weak MACD momentum, sub-40 RSI and the developing double top favor caution, while the oversold conditions leave room for a sharp rebound. The broader fundamental backdrop also remains challenging as Fed hike expectations and higher oil prices support the dollar and yields. For now, $63.86 is the key defense, with $63.08 the next downside trigger and $65.87–$66.24 the main recovery zone.
Sources & Methodology
Primary-source standard: Market-moving facts should link to original data releases, regulator notices, company filings or official project announcements whenever available. Secondary reporting is used for additional context, not as a substitute for original evidence.
Page last reviewed: