
Brent crude is trading near $107.69 on the 5-hour chart after a sharp advance pushed prices toward the $109.97 resistance area. The market remains structurally bullish, with prices above the 50-period simple moving average and inside the Ichimoku cloud, but momentum indicators are no longer confirming the rally. Recent market data show Brent reached a four-month high around $109.97 before retreating, while Wednesday trading has been pressured by a jump in U.S. crude inventories.
Brent Price Meets Strong Resistance
Brent has entered a critical consolidation phase after its recent surge. The benchmark climbed to a four-month high of $109.97 on September 11 before pulling back, and it settled at $108.75 on September 15 after gaining 2.9%.
At around $107.69, the market remains above the 50-period SMA near $101.30, preserving the broader bullish structure described in the technical setup. However, the inability to decisively clear $109.97 suggests buyers are facing increasing resistance after the rapid advance.
The technical picture is also being challenged by weaker momentum. Bearish divergence between price and the RSI and MACD indicates that the latest highs are not receiving the same momentum confirmation as earlier in the move. That matters because a market can continue rising despite divergence, but a failure to hold nearby support can turn the warning into a deeper correction.
Key Levels Define the Next Move
The immediate battle is concentrated between $105.10 and $109.97. The lower boundary has already proved important, with Brent futures touching $105.10 during the September 15 session before recovering to close higher.
A sustained break above $109.97 would remove the immediate range ceiling and place $112.00 on the technical radar. Conversely, a decisive move below $105.10 would weaken the short-term structure and expose the next support around $103.10.
- Resistance: $109.97
- Breakout level: $110.00
- First support: $105.10
- Next support: $103.10
- 50-period SMA: $101.30
Wednesday’s fundamental backdrop is less supportive. Reuters reported that Brent fell to around $107.53 after the American Petroleum Institute indicated a 7.1 million-barrel increase in U.S. crude inventories, far above expectations for a 1.6 million-barrel decline. Supply disruptions in the Middle East, however, continue to limit the downside.
RSI and MACD Signal Caution
The RSI and MACD divergences are the main technical warning signs. While Brent remains elevated, momentum indicators have weakened, suggesting that buying pressure is losing strength near the upper boundary of the recent range.
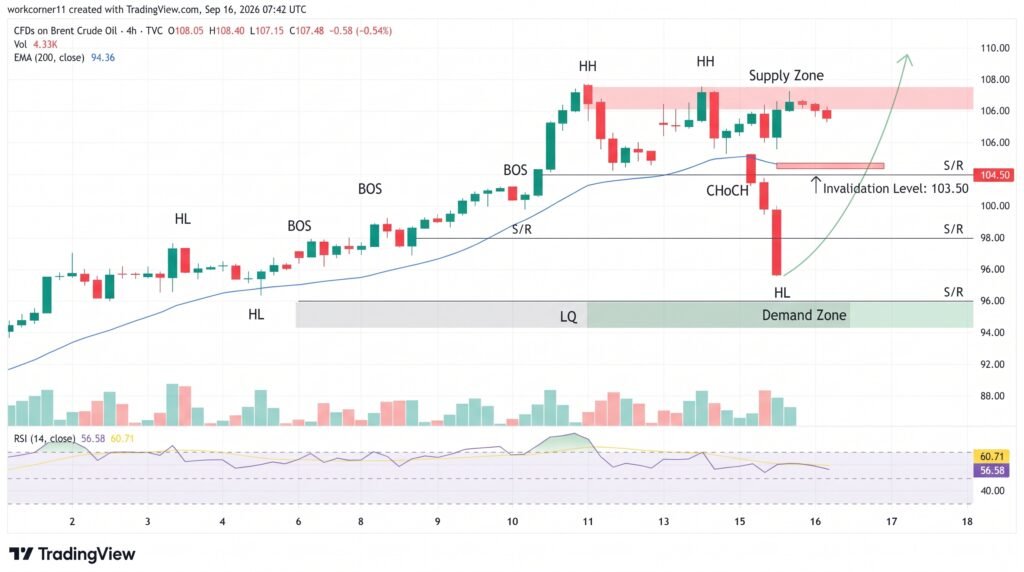
The ATR near 1.85 points to daily price swings of roughly 1.7%, meaning relatively large moves remain normal for the current market environment. Brent is also trading substantially above its longer-term moving averages, highlighting how far prices have moved during the recent rally.
The broader supply picture remains important. Disruptions involving Saudi infrastructure, the Strait of Hormuz and Red Sea shipping routes have kept crude markets tight despite the latest inventory increase.
Conclusion:
Brent oil remains technically bullish above $105.10, but the combination of $109.97 resistance, bearish RSI and MACD divergence, and elevated positioning leaves the market vulnerable to a sharper pullback. A break above $109.97 would strengthen the upside structure and bring $112.00 into focus, while a loss of $105.10 would shift attention toward $103.10 and potentially the $101.30 moving-average area.
Sources & Methodology
Primary-source standard: Market-moving facts should link to original data releases, regulator notices, company filings or official project announcements whenever available. Secondary reporting is used for additional context, not as a substitute for original evidence.
Page last reviewed: